Looking for more current trends in urgent care? Check out our visit volume tracker or see the latest data in our Urgent Care Quarterly. Read on for 2020 data.
Since 2008, Urgent Care Association (UCA) has produced a benchmarking survey and report to provide insights that will help urgent care teams prepare for what is to come. This information can be used to set your own center’s benchmarks, and also to identify potential growth opportunities within your operations.
Here are reports on visit volume and diagnosis trends through 2020 and into the first months of 2021.
Visit Trends in Urgent Care
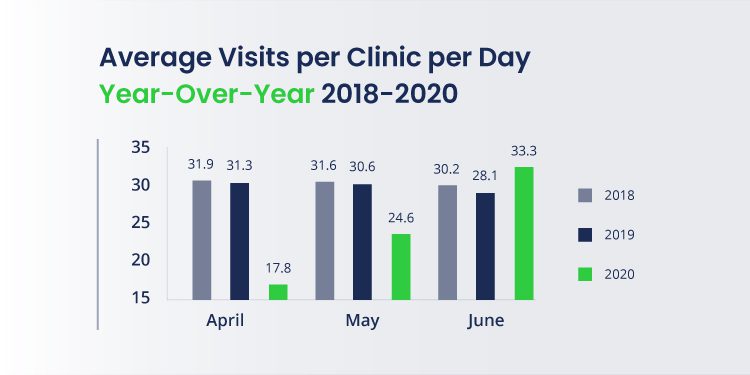
Visit volume is one of the most important performance metrics in urgent care. For this UCA report, we looked at averages from April, May, and June over the past three years to help you gauge your performance against industry benchmarks.
Average visit volume per clinic per day in 2018 and 2019 hovered right at the 30-visits-per-clinic-per-day mark. 2020 will always be an outlier due to the COVID-19 Public Health Emergency—and the data shows it. In quarter two of 2020, urgent care saw an all-time low in visits per clinic per day. April 2020 marked the lowest month on record with an average of 17.8 visits per day.
The story you’re not seeing in the data is the visit volume rollercoaster urgent care rode throughout 2020. The lows of quarter two turned into recording-breaking highs throughout the summer, fall, and winter months with clinics averaging 50+ visits per clinic per day due to COVID-19 testing volumes and urgent care’s overall boom.
The early months of 2021 have proven that visit volume remains higher than our year-over-year averages but is stabilizing between 45-50 patient visits per clinic per day.
More data resources:
Diagnosis Trends in Urgent Care
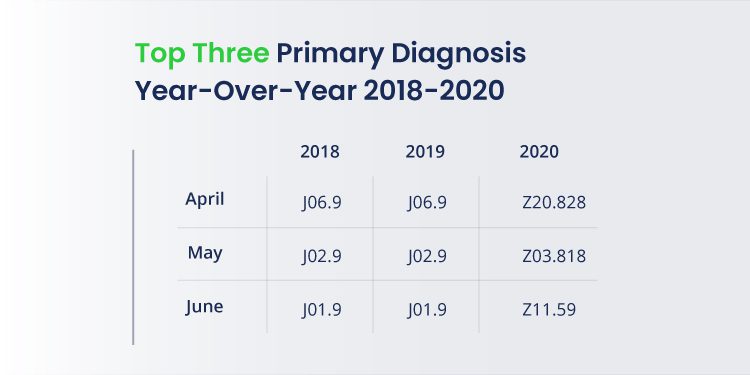
Urgent care was built on treating a handful of acute illnesses throughout the year keeping our businesses thriving. For this UCA report, we looked at the top three primary diagnoses from April, May, and June over the past three years to help you benchmark. In 2018 and 2019, the diagnosis codes were consistent and followed expected urgent care trends. In April, May, and June, upper respiratory infections, sore throats, and sinusitis topped the list. But in 2020, everything changed. The past year will always be an outlier due to the COVID-19 Public Health Emergency—and the data shows it. In quarter two of 2020, COVID-19 visits were not surprisingly the most common of all urgent care visit types.
The story you’re not seeing in the data is what happened to the flu throughout 2020 and beyond. For more on this topic, visit our blog, What Urgent Cares Need to Know about COVID-19 + Flu Season, to learn more.
More data resources:
- Use New ICD-10 Codes for Accurate Urgent Care Claims
- Coding During the Public Health Emergency
- Urgent Care Quarterly: Analysis of ICD-10, CPT, and E/M Coding Over Five Years
What’s Ahead
The continued emphasis on testing combined with the push to get Americans vaccinated continues to impact urgent care clinics and the entire industry. As we watch the COVID-19 infection rate slow at the same time new strains are discovered, 2021 may continue to break the norms.
Experity’s Emerging Trend
In December, +70% of visits were COVID-19 related. As of the first week of February, this metric has dropped below 60% for the first time since September 2020.

You can read more about UCA benchmarking reports here. To learn about Experity’s products designed specifically for urgent care, explore the solutions on our homepage.