Tracking Urgent Care Visit Volume

Flu Activity Remains Elevated

After a slow start, flu activity increased across the country late in 2025. Regionally, flu first showed up along the Atlantic coast and southwestern states. That activity has now made it’s way across the U.S., with a significant increase across the Midwest. After a steady rise in visit volume from November 1 through the holidays, the number of visits sharply declined, and continues to drop into the new year. The CDC estimates that there have been at least 23,000,000 illnesses, 300,000 hospitalizations, and 19,000 deaths from flu so far this season.

Last Updated March 13, 2026

Line graph titled "T7d Visits Per Clinic Per Day - PVP" showing 2014 and 2015 projections (blue and green lines) and actual visit data (red line) from 1/1/2015 to 12/6/2015.

Visits Per Clinic Per Day

30 Average Daily Visits Per Clinic

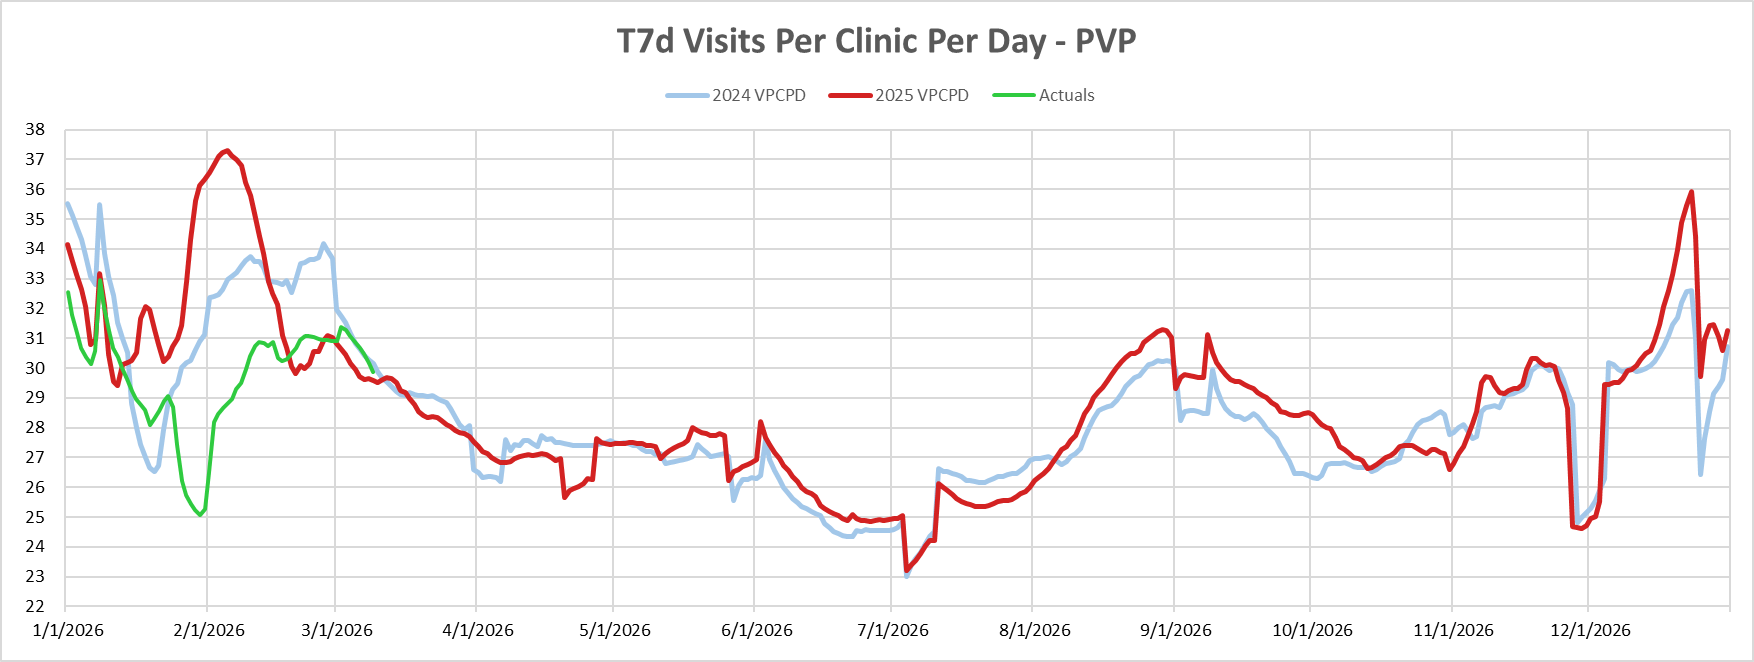
After a significant increase in visit volume from 29 to 36 visits per clinic per date in December, we’ve seen visit maintain a steady volumes as we head into the Spring months. As of early-March, the 7-day rolling average 30 visits per visit per day. Last year, urgent care visits spiked from late January through mid-February, directly contrasting what we’re seeing in 2026.

Source: Experity data

Line graph showing 7-day averages of clinic visits, flu tests, and flu test positivity rates per day from April 2021 to April 2023, with notable peaks in flu activity each winter season.

Visits per clinic per day VS. Flu Seasonality

Flu Positivity Holds Steady Through Mid-March

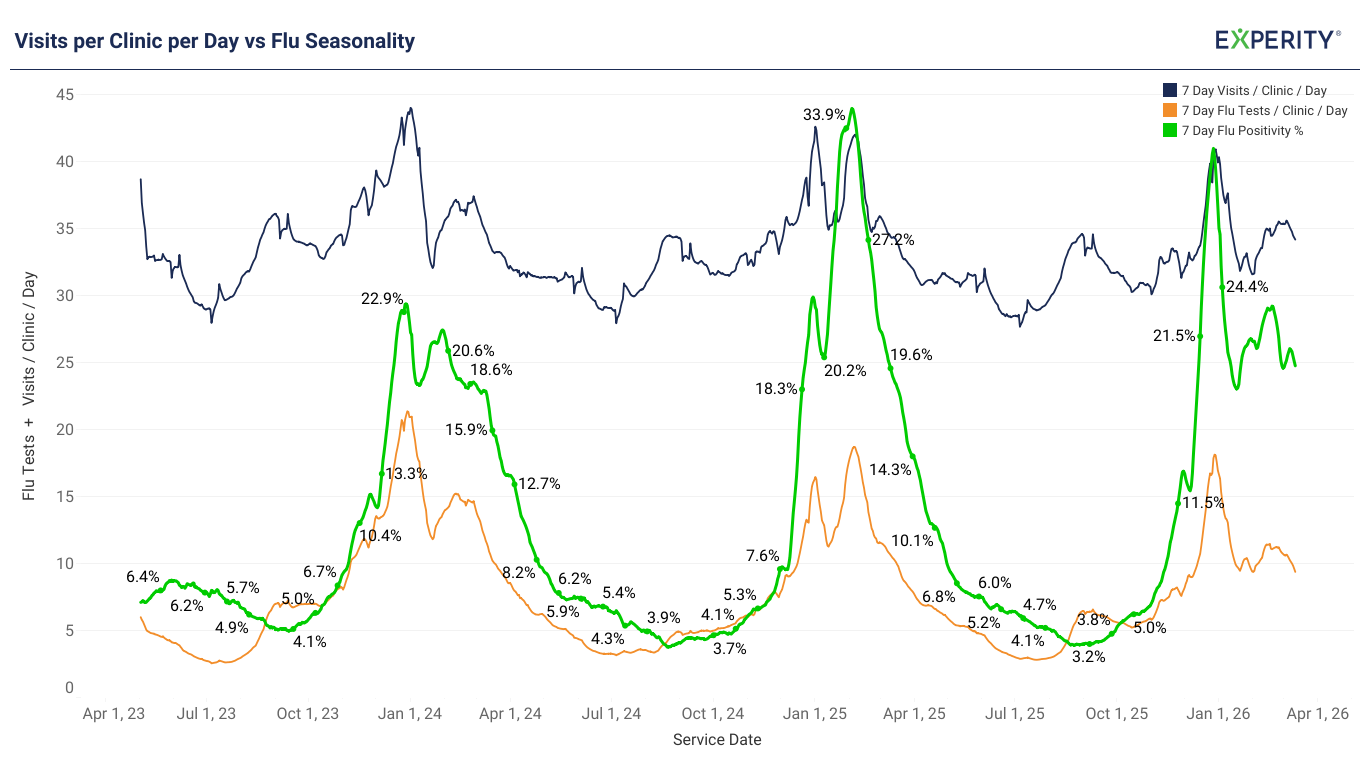
As we approach the end of the first quarter of the year, we’re seeing fewer positive lab results for flu when compared to December rush but a recent surge brings the 7-day rolling average for flu positivity remains up from 18% from pre-Flu season levels in Q4 of last year.

Source: Experity Data

U.S. map showing state-by-state flu positivity rates, ranging from 12.1% to 30.0%, with varying shades of green indicating different levels of positivity.

Flu Positivity

Idaho and South Dakota Rank First in Positive Flu Cases

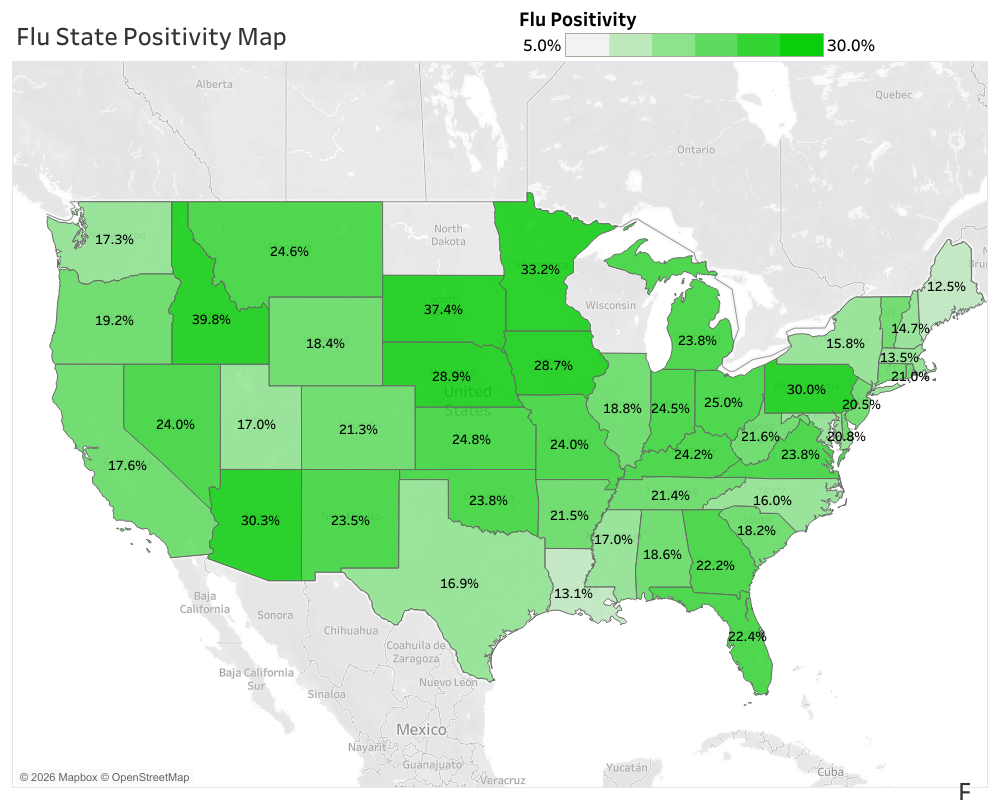
Over the last few weeks, our maps have maintained their deep shade of green all across the country, indicating that flu season is still alive and well. Flu positivity in Idaho and South Dakota is currently higher than any other states. This does not mean the states have more cases, but that more than 37%+ of upper respiratory illness visits result in a positive flu diagnosis.

Source: Experity Data

A map of the US and parts of Canada and Mexico shows flu test positivity by lab count in the last 7 days, with varying sizes and shades of orange circles indicating case prevalence.

Flu Testing Heat Map
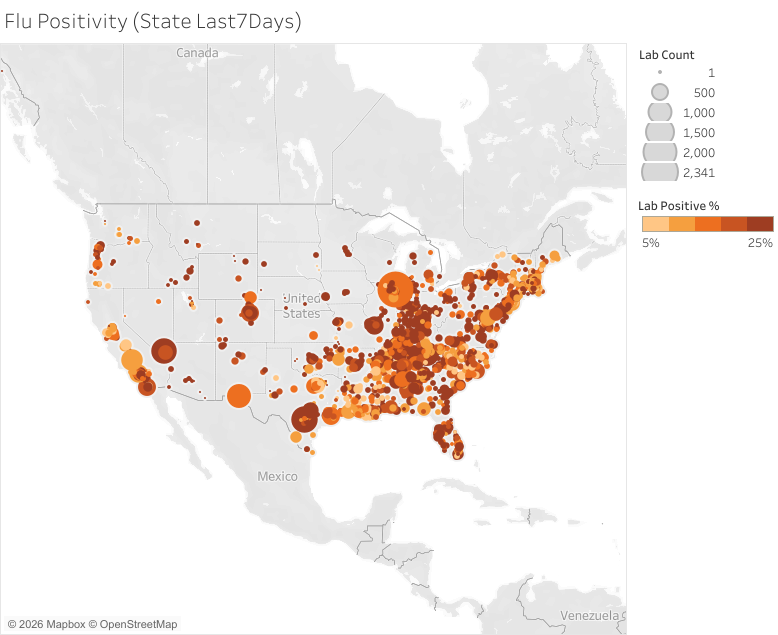
Flu Hot Spots

According to our data, the highest concentration of flu activity resulting in lab testing and positive diagnoses is across the eastern and southeastern U.S.

Resources to Revitalize your Urgent Care Business

Check out some of our top resources to help urgent cares manage and leverage fluctuating visit volume to secure continued business growth throughout the year.