Tracking Urgent Care Visit Volume

Flu Activity Remains Elevated

After a slow start, flu activity increased across the country late in 2025. Regionally, flu first showed up along the Atlantic coast and southwestern states. That activity has now made it’s way across the U.S., with a significant increase across the Midwest. After a steady rise in visit volume from November 1 through the holidays, the number of visits sharply declined, and continues to drop into the new year. The CDC estimates that there have been at least 23,000,000 illnesses, 300,000 hospitalizations, and 19,000 deaths from flu so far this season.

Last Updated February 17, 2026

Line graph showing 7-day visits per clinic per day for PVP in 2015 (green), 2014 (blue), and actuals (red) from 1/1/2015 to 12/31/2015, with data fluctuations over time.

Visits Per Clinic Per Day

30 Average Daily Visits Per Clinic

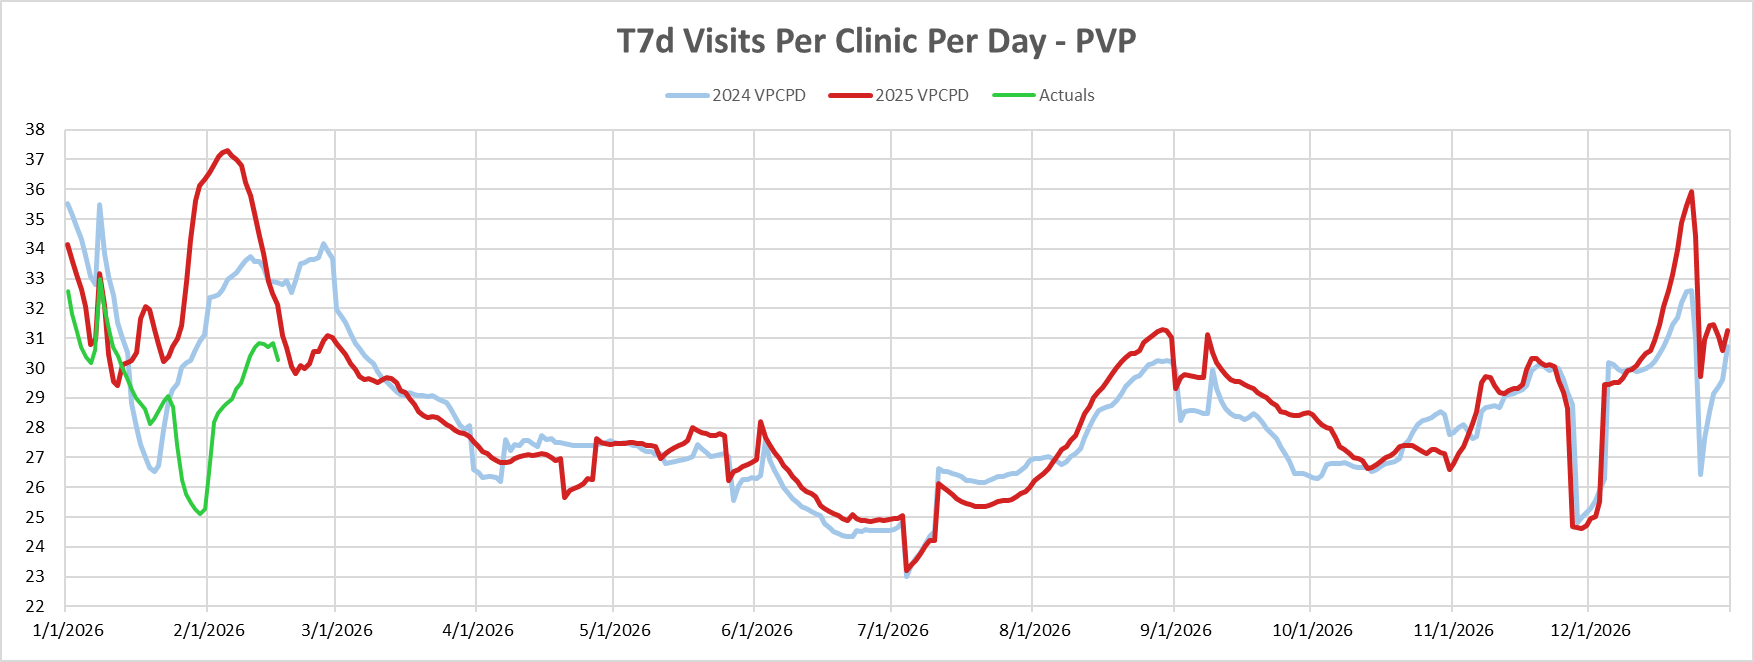
After a significant increase in visit volume from 29 to 36 visits per clinic per date in December, we’ve seen a sharp decrease in urgent care visits. As of mid-February, the 7-day rolling average 30 visits per visit per day. Last year, urgent care visits spiked from late January through mid-February, directly contrasting what we’re seeing in 2026.

Source: Experity data

Line graph showing daily clinic visits, flu test percentage, and flu positivity rates from Sept 2020 to Mar 2026, with flu peaks in winter months and declines in summer.

Visits per clinic per day VS. Flu Seasonality

Flu Positivity Up 5% Since Mid-January

As we hit the midway mark of the first quarter of the year, we’re seeing fewer positive lab results for flu when compared to December rush but a recent surge brings the 7-day rolling average for flu positivity up from 23% in mid-January to 28% on February 17.

Source: Experity Data

A US map shows flu positivity rates by state, ranging from 5% to 30%, with darker green indicating higher rates and lighter green lower rates. States are labeled with their respective percentages.

Flu Positivity

Nebraska Ranks First in Positive Flu Cases

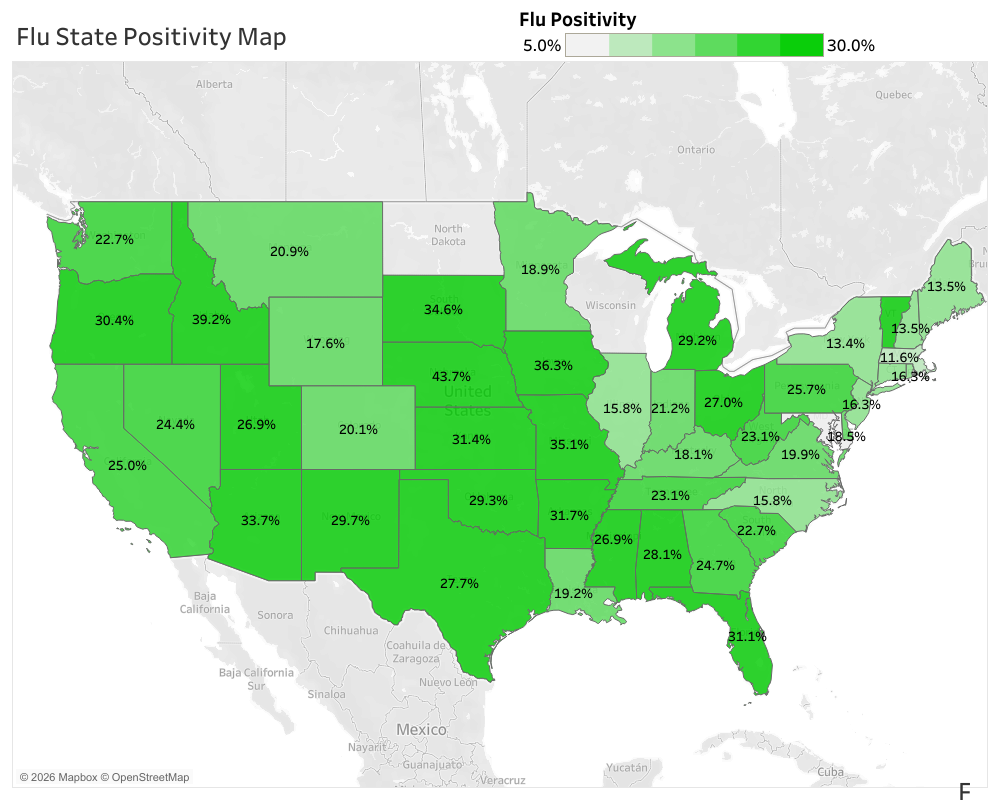
Over the last two weeks, our maps have turned a much deeper shade of green all across the country, indicating that flu season is still alive and well. Flu positivity in Nebraska is currently higher than any other state. This does not mean the state has more cases, but that more than 43% of upper respiratory illness visits result in a positive flu diagnosis.

Source: Experity Data

Map of the US showing flu positivity rates by lab count; larger and darker circles indicate higher positivity, mainly concentrated in the South and Southeast.

Flu Testing Heat Map

Flu Hot Spots

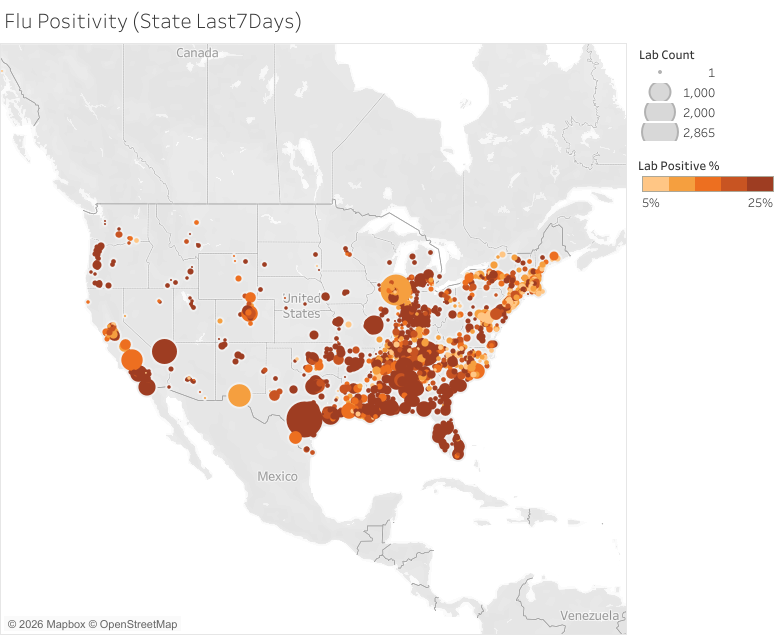
According to our data, the highest concentration of flu activity resulting in lab testing and positive diagnoses is across the eastern and southeastern U.S.

Resources to Revitalize your Urgent Care Business

Check out some of our top resources to help urgent cares manage and leverage fluctuating visit volume to secure continued business growth throughout the year.