Each quarter, we measure the metrics and drill down on the data to bring you relevant information specific to the dynamic urgent care industry. In our first issue of Urgent Care Quarterly, we looked at flu seasons over the last four years to identify trends and insights. In our current issue, we’ll explore urgent care visit volume year over year. We provide data today, so you can make better decisions about tomorrow.
The difference one visit makes
To get a birds-eye view of the visit volume data, we thought it made sense to first look at daily visit volume year over year, and how it has changed over time. While the difference between years looks insignificant on the surface, a daily swing of even one visit can result in roughly a $30,000 difference in annual revenue for a single clinic. [Figure A.]
Figure A:
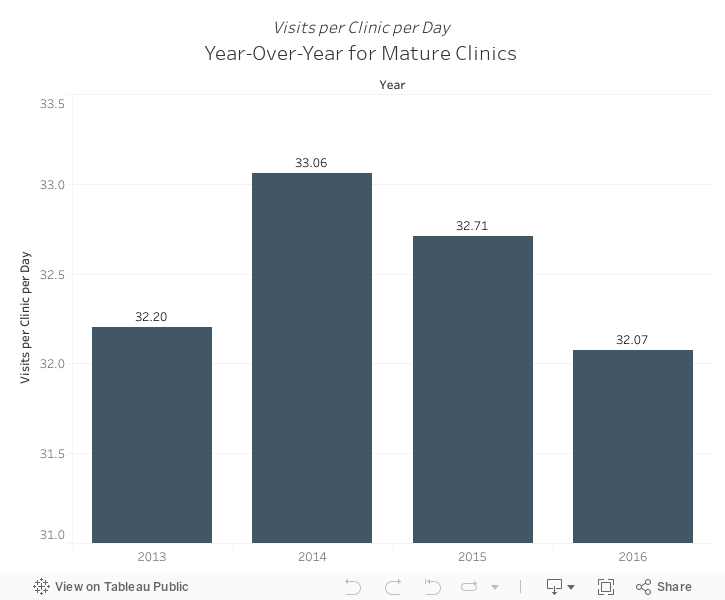
Our data indicates that average visits per day for mature clinics have decreased over the past two years after a nice increase in 2014. From 2014 through 2016, visits went from 33.06 to 32.07 visits per clinic per day—a one percent decrease in 2015, followed by a three percent decrease in 2016. Not surprisingly, this data lines up with a strong flu season in 2014 and less severe flu seasons in 2015 and 2016.
To dive deeper into urgent care data from the last four flu seasons, see our last issue of Urgent Care Quarterly.
While factors like location, competition, and pre-launch marketing affect the launch of individual startup clinics, when it comes to visit volume, the startup ramp has been consistent over the last three years. [Figure B.]
Figure B:
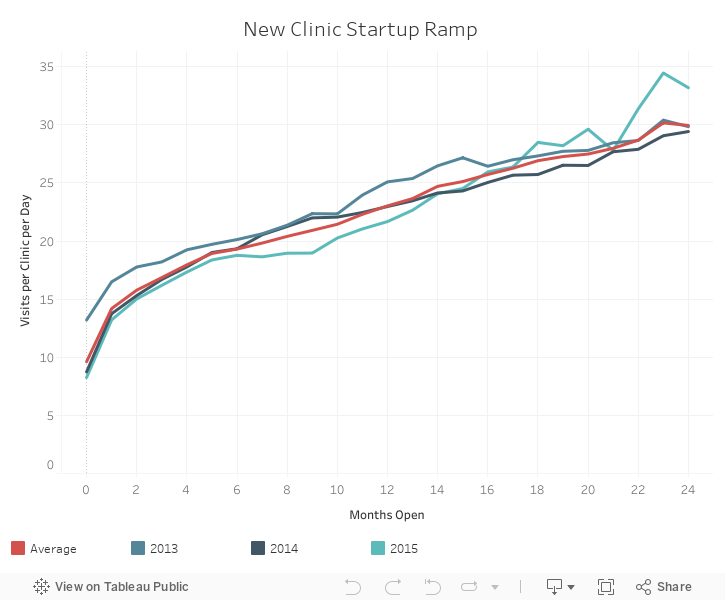
Whether you opened a clinic in 2013, 2014, or 2015, the number of visits per day shows a steady increase from less than ten visits per day at opening, to approximately 30 visits per day on average at the two-year mark. This is when visit volume levels off and becomes more consistent. This trend holds true whether it’s the first clinic for a new organization or the tenth clinic opening for an existing organization.
If you’re starting an urgent care clinic, the metrics suggest that your business plan should include financial resources to sustain your clinic for the first two years while you get to a consistent visit volume.
Looking at average visits per clinic per day by month, we can see that volume is at its highest—around 35 visits per day—November through March during peak cold and flu season. During the summer months of June and July, visit volume is at its lowest with fewer than 30 visits per day. [Figure C.]
Figure C:
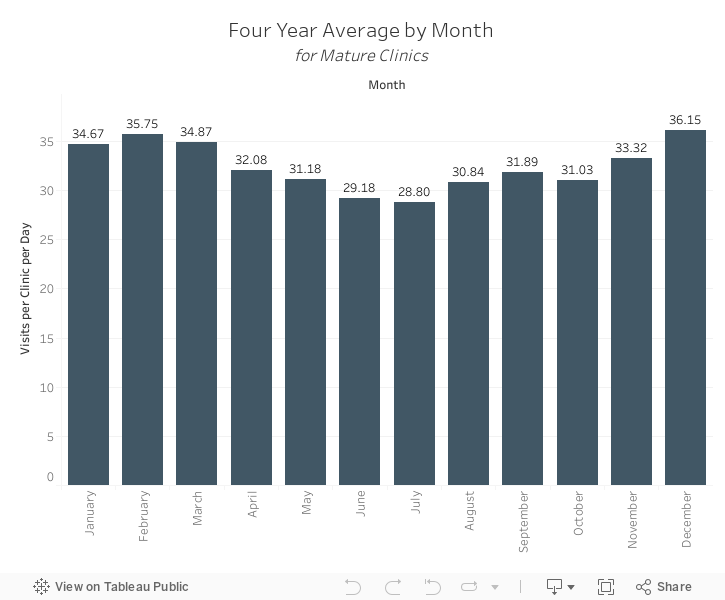
I’m sure it’s no surprise to anyone reading this that visit volume is seasonal, gradually dropping off from March through July, then growing again into the fall.
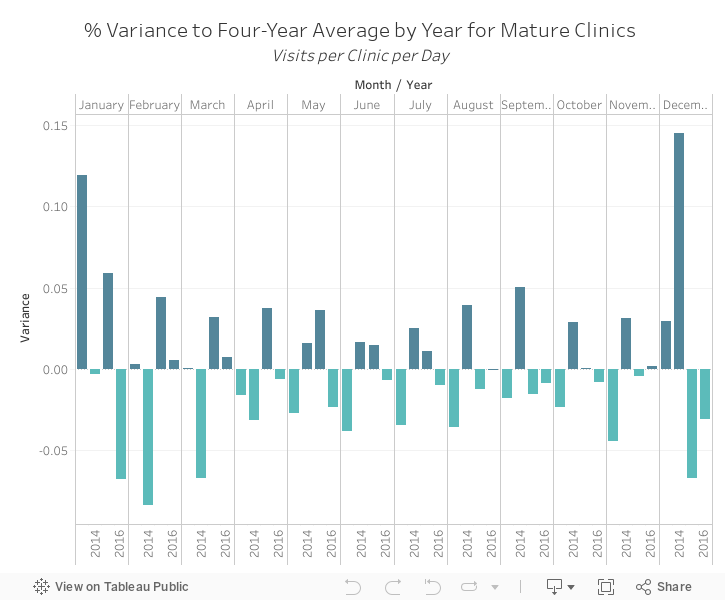
Looking at the variance by year, you can see how each month in 2013-2016 performed against the average. It’s worth noting that during 2016, only February and March showed a visit volume higher than the three-year average. This is most likely due to the 2016 flu season beginning later than usual and peaking in February of 2017. [Figure D.]
Figure D:
Adding services such as occupational medicine (OccMed) and workers’ compensation has been a popular strategy for urgent care centers hoping to increase and balance visit volume. We wanted to see if there was a sweet spot defining the ideal percentage of OccMed visits, so we compared urgent cares that provide different levels of employer healthcare as a percent of their total visits. With the majority of clinics we sampled (67 percent), OccMed visits made up less than five percent of total visits. [Figure E.]
Figure E:
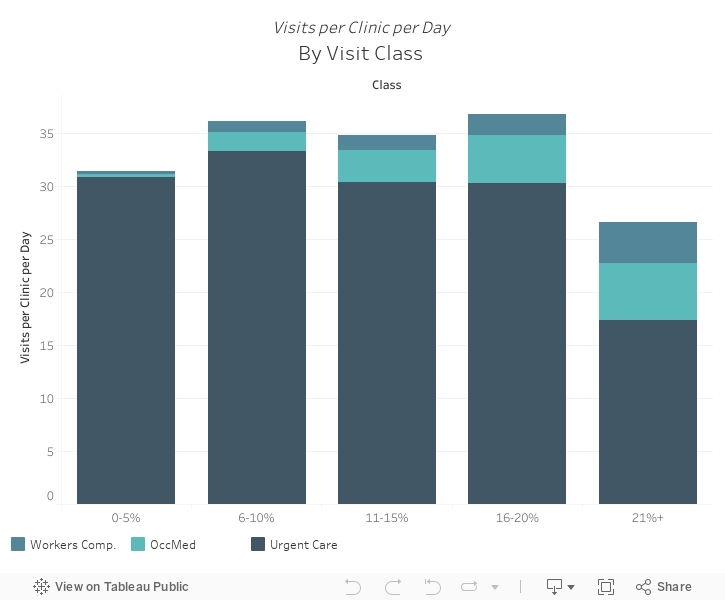
Clinics with OccMed and workers’ comp visits in the 16–20 percent range ended up with the most overall visits. Once employer visits surpassed the 20 percent mark, clinics saw an average of six fewer visits than those whose OccMed visits account for less than 20 percent of total visits.
While it’s impossible to determine a causal relationship between OccMed and the decrease in visits, some possibilities to consider are door-to-door time for an urgent care visit versus a workers’ comp or other OccMed visit, hours of operation, and business model.
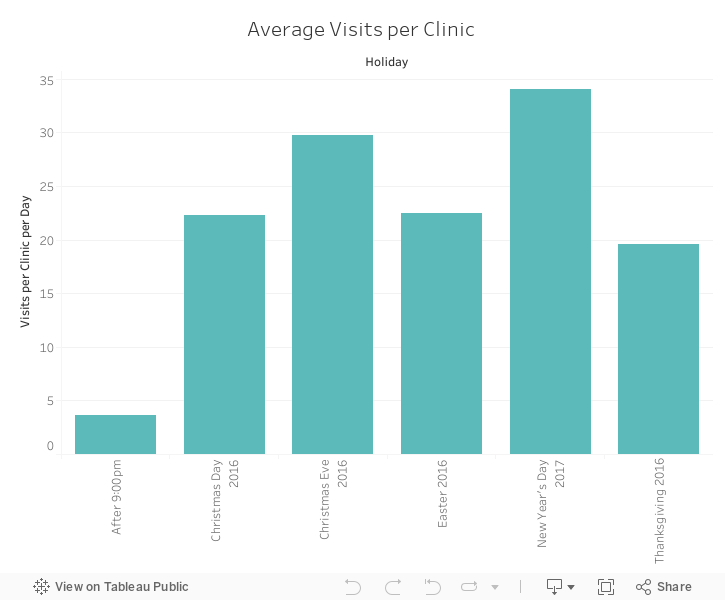
Many patients come to urgent care clinics for convenience. When people think of urgent care they think, open late, open on weekends, open on holidays. This isn’t always true. While in 2016, more than 80 percent of urgent cares were open on Christmas Eve, and 62 percent were open on New Year’s Day, only 21 percent were open on Christmas Day. More than 70 percent of clinics were open on Easter, but just over a third were open on Thanksgiving. The average visits per clinic on holidays ranges from about 20 on Thanksgiving to about 34 on New Year’s Day—which may surpass average daily volumes for some clinics.
Very few clinics—fewer than two percent—are open after 9:00 p.m. And while the average visit volume is less than five visits per clinic, it’s worth looking at the possibility of offering this important benefit to patients in your area.
When you compare your clinic’s average visits with this data and do a little research on your competitors, you may discover an opportunity to increase revenue and visibility in your community by staying open on holidays. If there are no clinics open on Christmas Day, you can become the provider that people count on every day—even holidays.
Figure I:
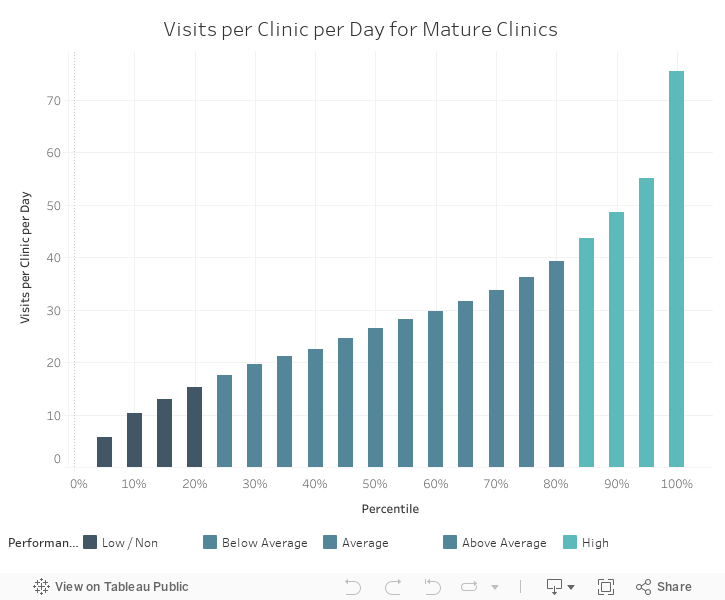
A look at urgent care visit volume data for 2016 can help you assess your clinic’s performance against market benchmarks and guide your decision making as you move forward.
In 2016, the average visits per clinic per day for mature clinics was 32.07 visits, and the median was 27.38. Looking at how your clinic measured up in comparison to these numbers is a reference point for evaluating performance.
If you are seeing more than 40 patients per day, congratulations, you’re a high performer. If you’re seeing more than 75 patients per day, you’re a rock star—or maybe the Warren Buffet of the urgent care industry.
If your clinic has been operational for more than a year and is averaging fewer than 15 visits per day, it’s time to take a good look at your business. What changes can you make to increase volume? Do you need to do something as drastic as changing locations? If you’re not sure how to proceed, consider hiring an urgent care consultant to provide direction and expertise. DocuTAP’s Consulting Services can help you examine your business plan and practice and find a way to increase your business with smart solutions.
Data Definitions:
Mature clinic: Open more than 12 months.
Non-mature clinic: Open 12 months or less.
Each quarter Experity publishes Urgent Care Quarterly where we dive deep into a data set and provide insight into urgent care trends. We look at the KPIs critical to the success of the industry—all with real, discrete data.
Figure F:
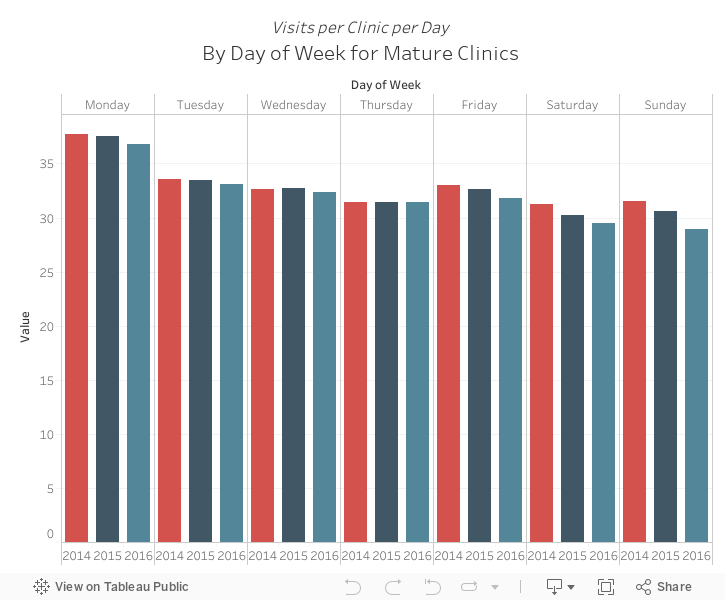
Over the past two years, urgent care visits per clinic per day have decreased for all days of the week, consistent with a drop in total visits per clinic year over year for the same time period. Monday continues to be the busiest day of the week and the only day of the week to average more than 35 visits per day.
Figure G:
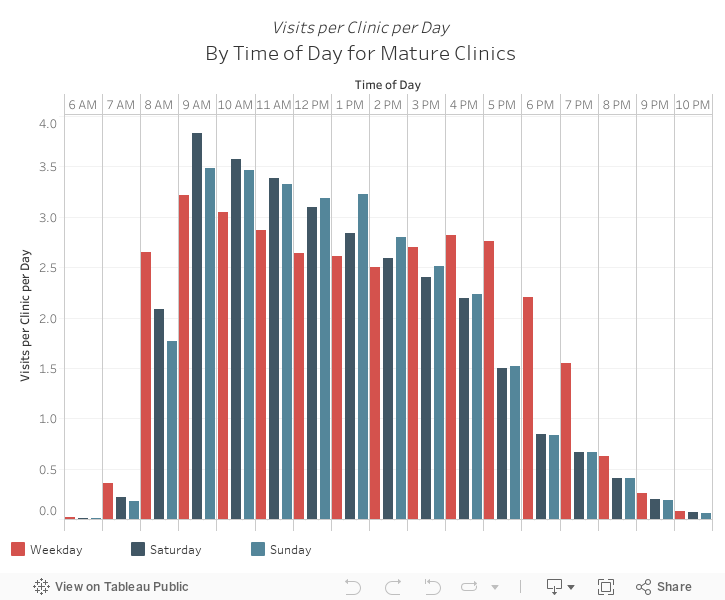
All days of the week show a quick peak in visits at 9 a.m. and gradually level out throughout the day, averaging between 2.5 and three visits per hour between 11 a.m. and 5 p.m. Saturday and Sunday visits show a similar pattern, except that visits begin to drop significantly after 3 p.m.—correlating to reduced hours on the weekend.
Figure H:
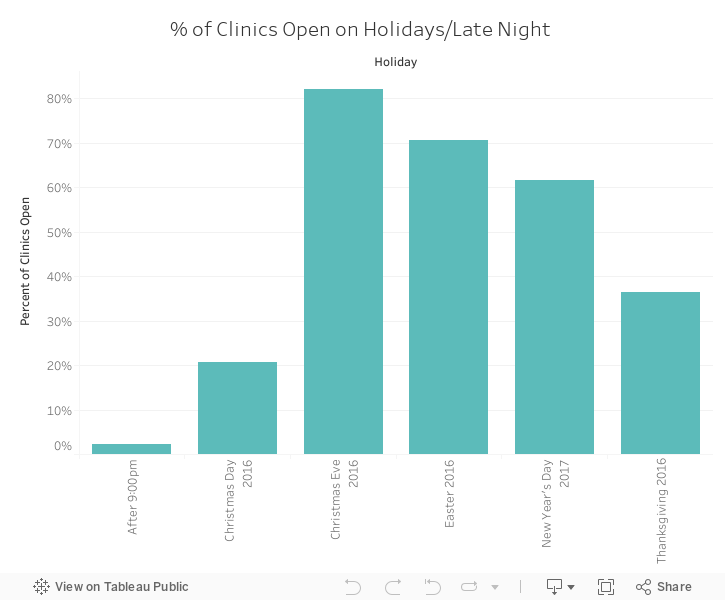
The percent of clinics open shows a large variance based on the holiday. While more than 80% of urgent cares are open on Christmas Eve, only 20% are open on Christmas Day. Average visit volume on holidays ranges from 20 to 34 visits per day.
Figure H2: