
Data drives today’s urgent care decision-making. Our goal with Urgent Care Quarterly is to support the industry with data-rich articles not only to share the data we collect, but to explain it in meaningful ways that help you make smart business decisions.
In our last issue, we explored reimbursement trends from 2013-2016 through a variety of lenses and looked at some of the areas that often impact revenue. In this issue, we dive deep into ICD-10, CPT®, and E/M coding in the context of urgent care. We hope that the data provided in this issue will help you to make informed decisions about your coding process and make adjustments toward greater success.
With every moment that passes, the practice of medicine becomes increasingly complex. New processes, technologies, and breakthroughs are poised to disrupt current protocols benefiting patients around the world. Gene editing and therapies to combat inherited diseases, a new class of drugs that significantly lowers bad cholesterol, the embrace of telehealth technologies, a flu shot that lasts a lifetime-these and other innovations are on the horizon and demonstrate the increasing speed at which medical practices must adapt.
With these changes, the ways we record diagnoses, document procedures, and report progress must be continually evaluated and modified to improve the accuracy of electronic medical records throughout the patient life-cycle, and to ensure doctors and other healthcare practitioners are appropriately and efficiently compensated for the important work they do.
In this Urgent Care Quarterly, we explore coding trends over the last five years as they relate to urgent care. We look at ICD-10, CPT®. and E/M codes to provide greater insight into what these trends mean for on-demand healthcare providers.
The data presented here is based solely on urgent care visits with closed claims. Data includes all codes relevant to each visit.
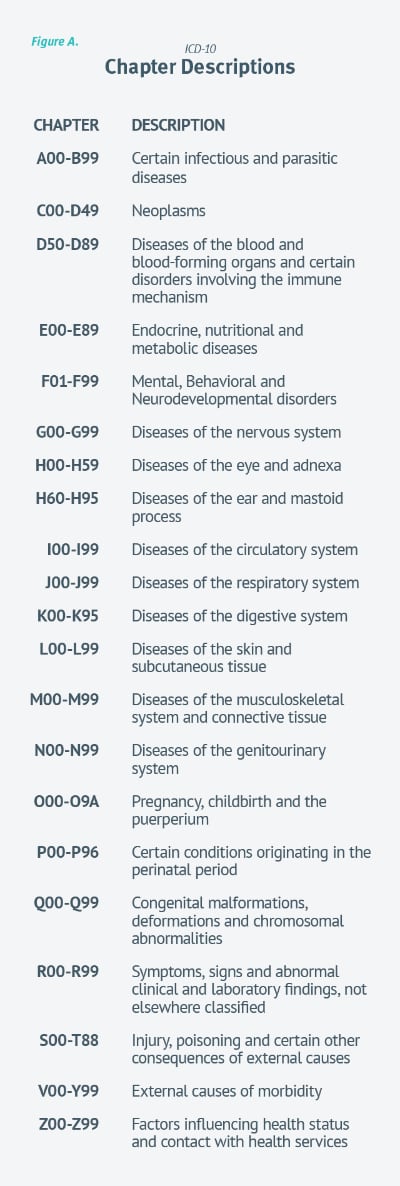
First let’s take a broad look at the most common ICD-10 diagnoses for 2016 and 2017. (See Figure A. for chapter descriptions.) Over the past two years, 55 percent of urgent care diagnoses fell into one of three ICD-10 chapters: JOO-J99, ROO-R99, and SOO-T88.
FIGURE A.
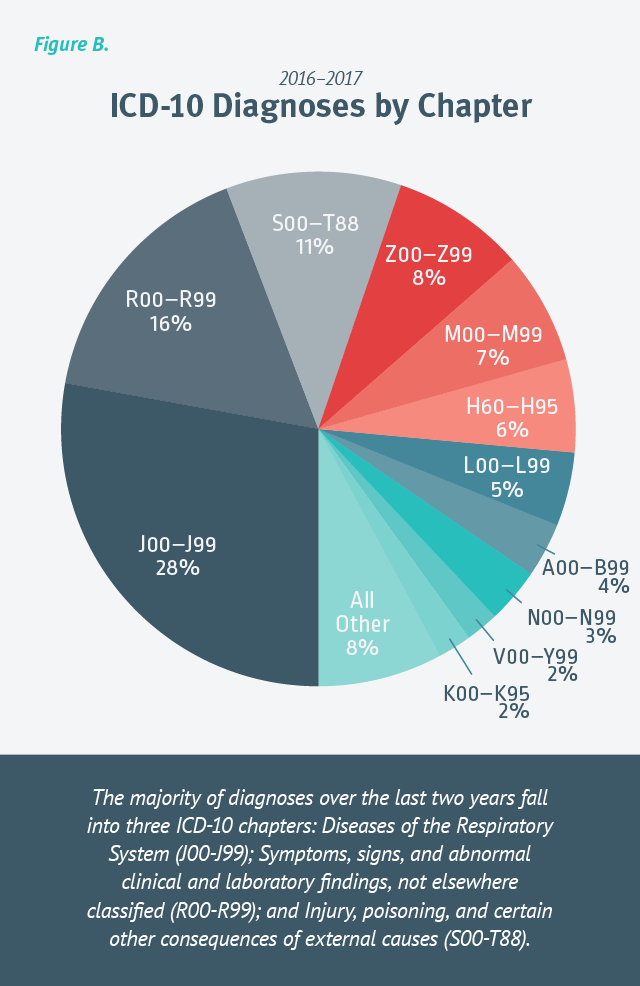
Diseases of the Respiratory System (JOO-J99) represent more than a quarter of all diagnoses during that period at 28 percent, with acute upper respiratory infections, acute pharyngitis, acute sinusitis, and acute bronchitis accounting for most of the categories within that chapter. The next most common diagnoses fell into Symptoms, signs, and abnormal clinical and laboratory findings, not elsewhere classified (ROO-R99) at 16 percent. The categories most used in this chapter were Symptoms and signs involving circulatory and respiratory systems (ROO-R09), such as cough. [Figure B.]
FIGURE B.
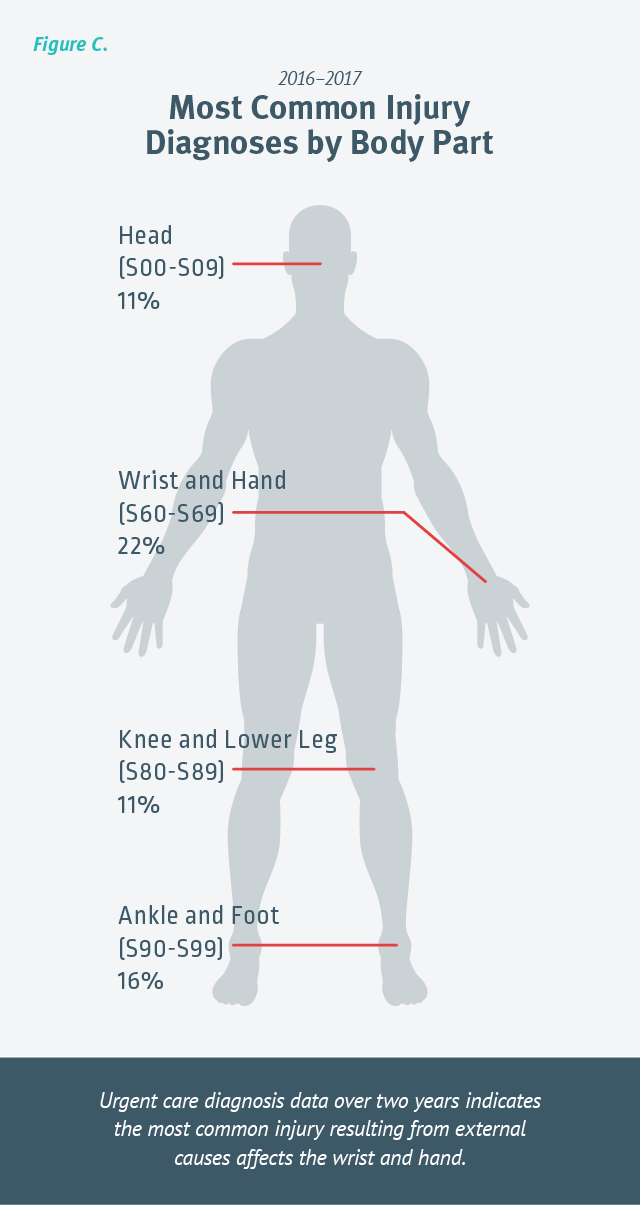
Injury, poisoning, and certain other consequences of external causes (SOO-T88) were the third most common diagnoses, bringing patients into clinics with injuries to the wrist and hand, ankle and foot, head, and knee and lower leg. [Figure C.]
FIGURE C.
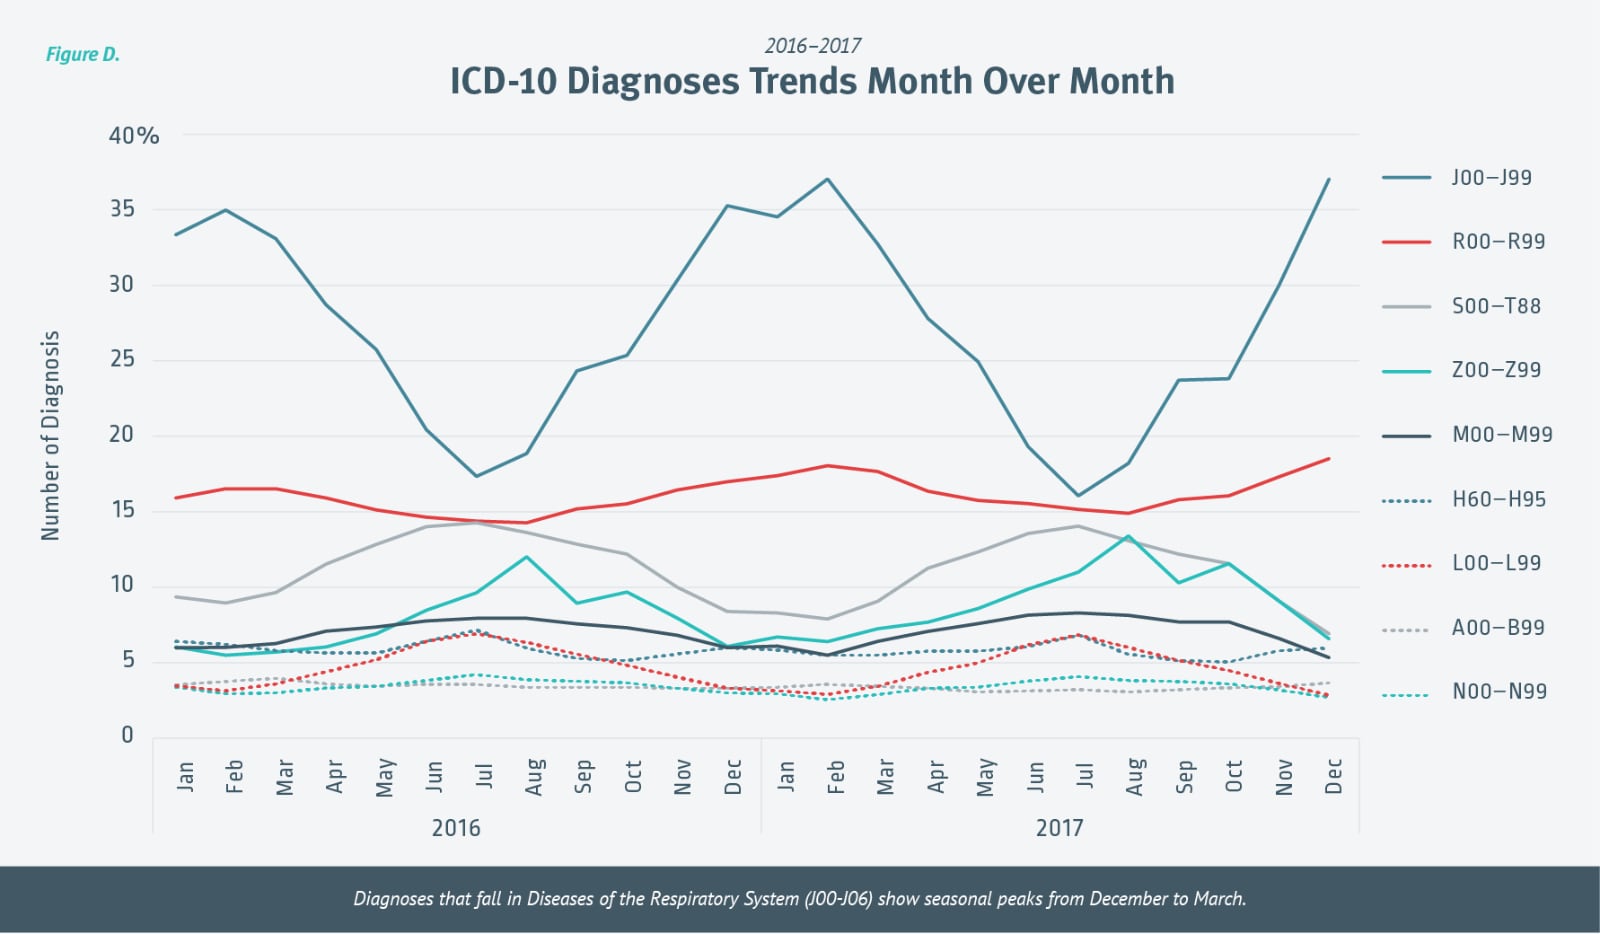
Looking at the two-year ICD-10 diagnoses trends month over month, we see that chapters with fewer diagnoses remain fairly constant year over year. Not surprisingly, diagnoses that fall in Diseases of the Respiratory System (J00-106) show seasonal peaks from December to March. [Figure D.] The data also indicates that Injury, poisoning, and certain other consequences of external causes (SOO-T88) diagnoses increase slightly mid-year and then again at the very end of the year.
FIGURE D.
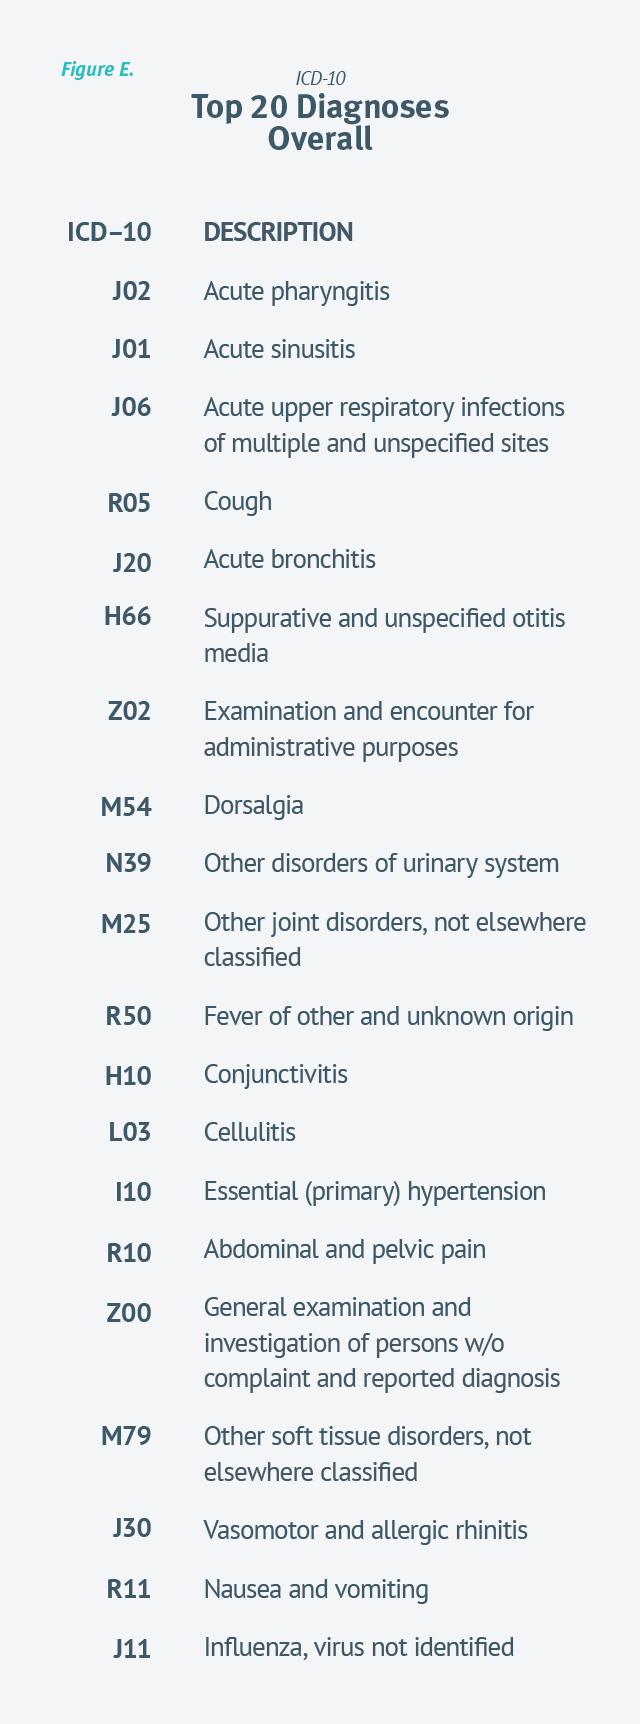
Out of 68,000 possible diagnoses codes, the top 20 [Figure E.] account for more than 50 percent of all urgent care diagnoses over the past two years.
Interesting to note, Influenza, virus not identified barely broke the top 20 over the last two years. We’ll watch to see if a strong flu season this year pushes that further up the list.
FIGURE E.
Looking at a deeper specificity level, we reviewed the top 10 diagnoses in and out of flu season. [Figure F.] According to data reported in Urgent Care Quarterly – Issue 02, urgent care visit volume is at its highest—around 35 visits per day—November through March during peak cold and flu season. While it may be reasonable to assume that the diagnoses in non-flu season months would vary dramatically from flu season diagnoses, the data indicates that the top 10 diagnoses in and out of flu season remain remarkably similar.
While it may be reasonable to assume that the diagnoses in non-flu season months would vary dramatically from flu season diagnoses, the data indicates that the top 10 diagnoses in and out of flu season remain remarkably similar.
FIGURE F.

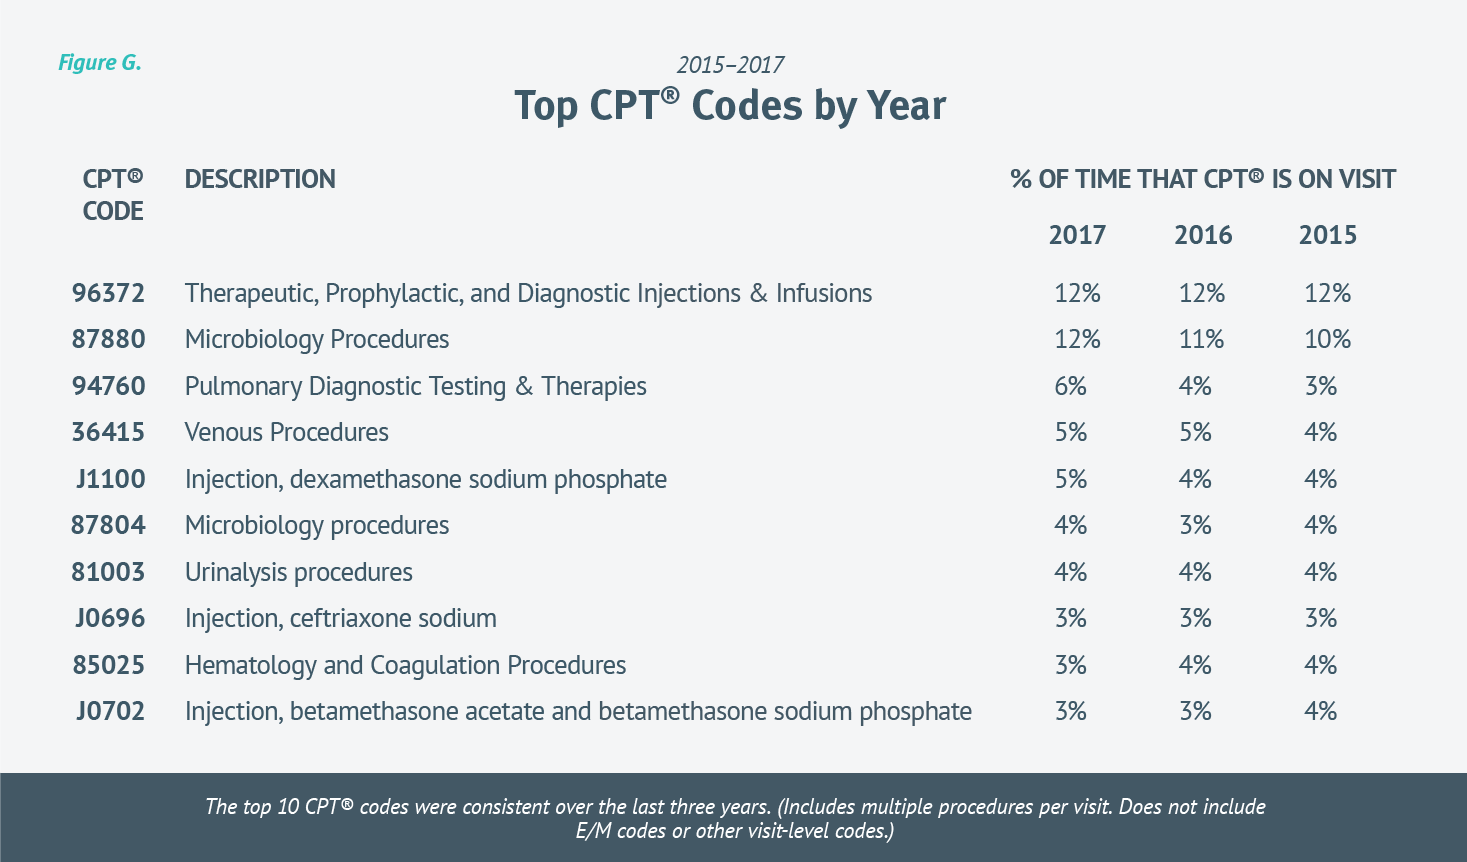
Looking at CPT® codes over the last three years, the top procedure code trends align with the analysis of ICD-10 code trends. In the same way we saw big similarities in most commonly used ICD-10 codes, we see similarities in most common CPT® codes.
Note, in our calculations we included a CPT whenever it was on a visit, meaning one visit could include multiple procedures.
Not including visit-level and E/M codes, the top 10 procedures are the same year over year, with a few simply switching spots. Twelve percent of visits included an injection (96372) each of the last three years. Rapid strep tests (87880) have increased each of the last three years; going from 10 percent in 2015, to 11 percent in 2016, to 12 percent of visits including a strep test in 2017. [Figure G.]
FIGURE G.
Accurate E/M coding is essential to correct reimbursement. Under-coding can result in substantial lost revenue, while frequent upcoding can be a red flag for auditors. We explored the E/M trends over five years to provide a reference point with the understanding that accuracy is key.
A quick look at E/M coding trends over the last five years tells us that levels three and four were by far the most common, and accounted for more than 90 percent of all new and established urgent care visits. But there were significant differences between new and established visits.
NEW VISITS
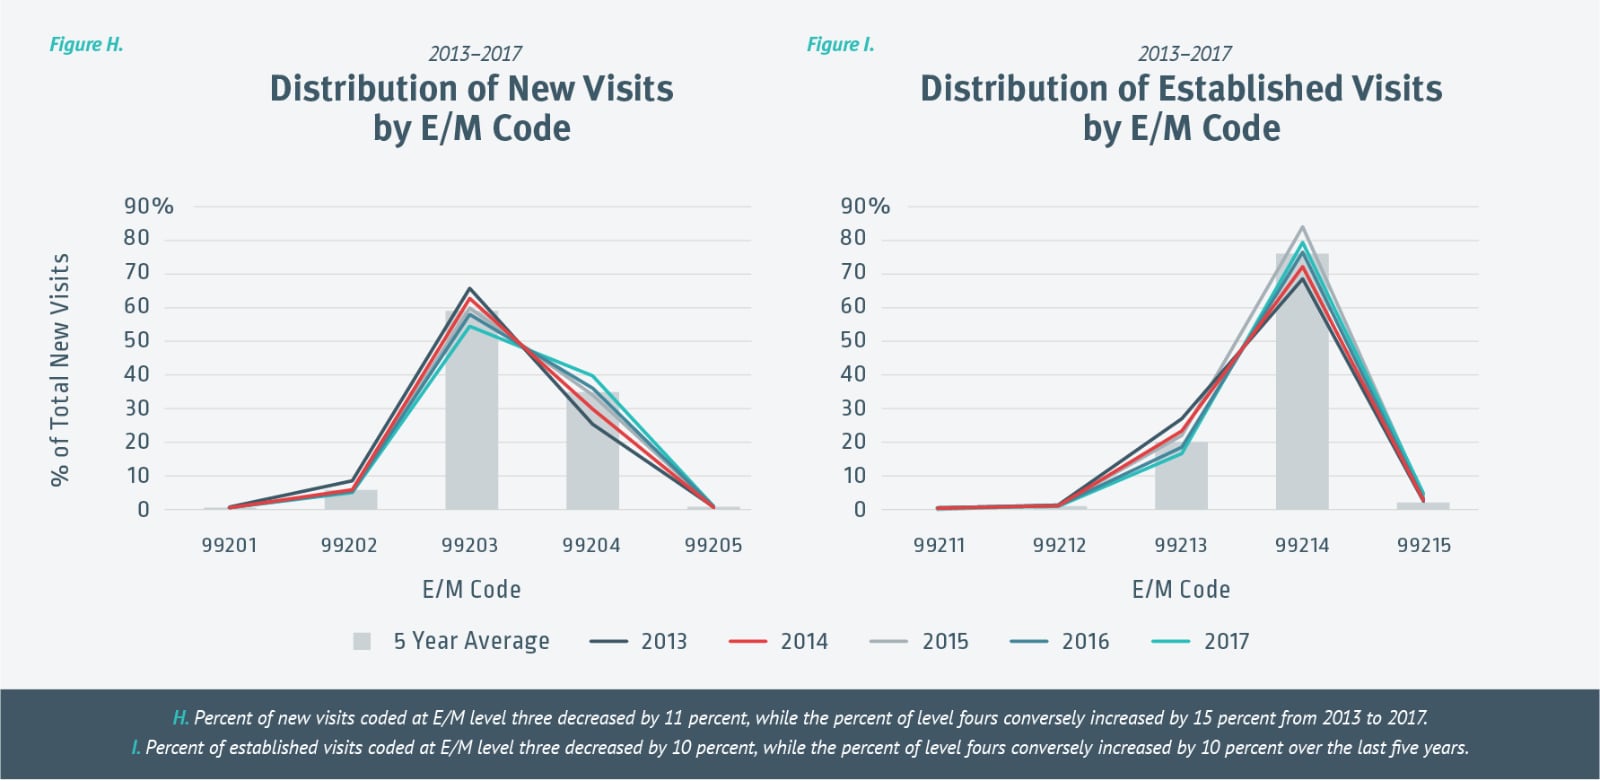
Over the past five years, the majority of all new visits (59 percent) were 99203s. The data also tells us that while year-over-year variance is minimal in E/M levels one, two, and five, the percentage of claims coded at E/M level three decreased each year (by 11 percent in total), while the percentage of level fours conversely increased each year (by 15 percent in total) from 2013 to 2017. [Figure H.]
A substantial majority of all established visits (76 percent) were coded as 99214s the last five years. Similar to E/M coding for new visits, the five-year variance for level one, two, and five visits was insignificant. However, there was a significant decrease (10 percent) in level threes, while level fours conversely increased by 10 percent. [Figure I.]
While it is difficult to pinpoint the reason for the increase in level fours, it’s possible that accuracy is improving as providers and coders gain more insight into coding rules. With technology, knowing you have the appropriate documentation gives confidence that you’re submitting appropriate claims. Also, it’s possible that urgent cares expanding their service offerings and/or treating more complex conditions through primary care services is resulting in higher E/M codes.
FIGURE H & I.
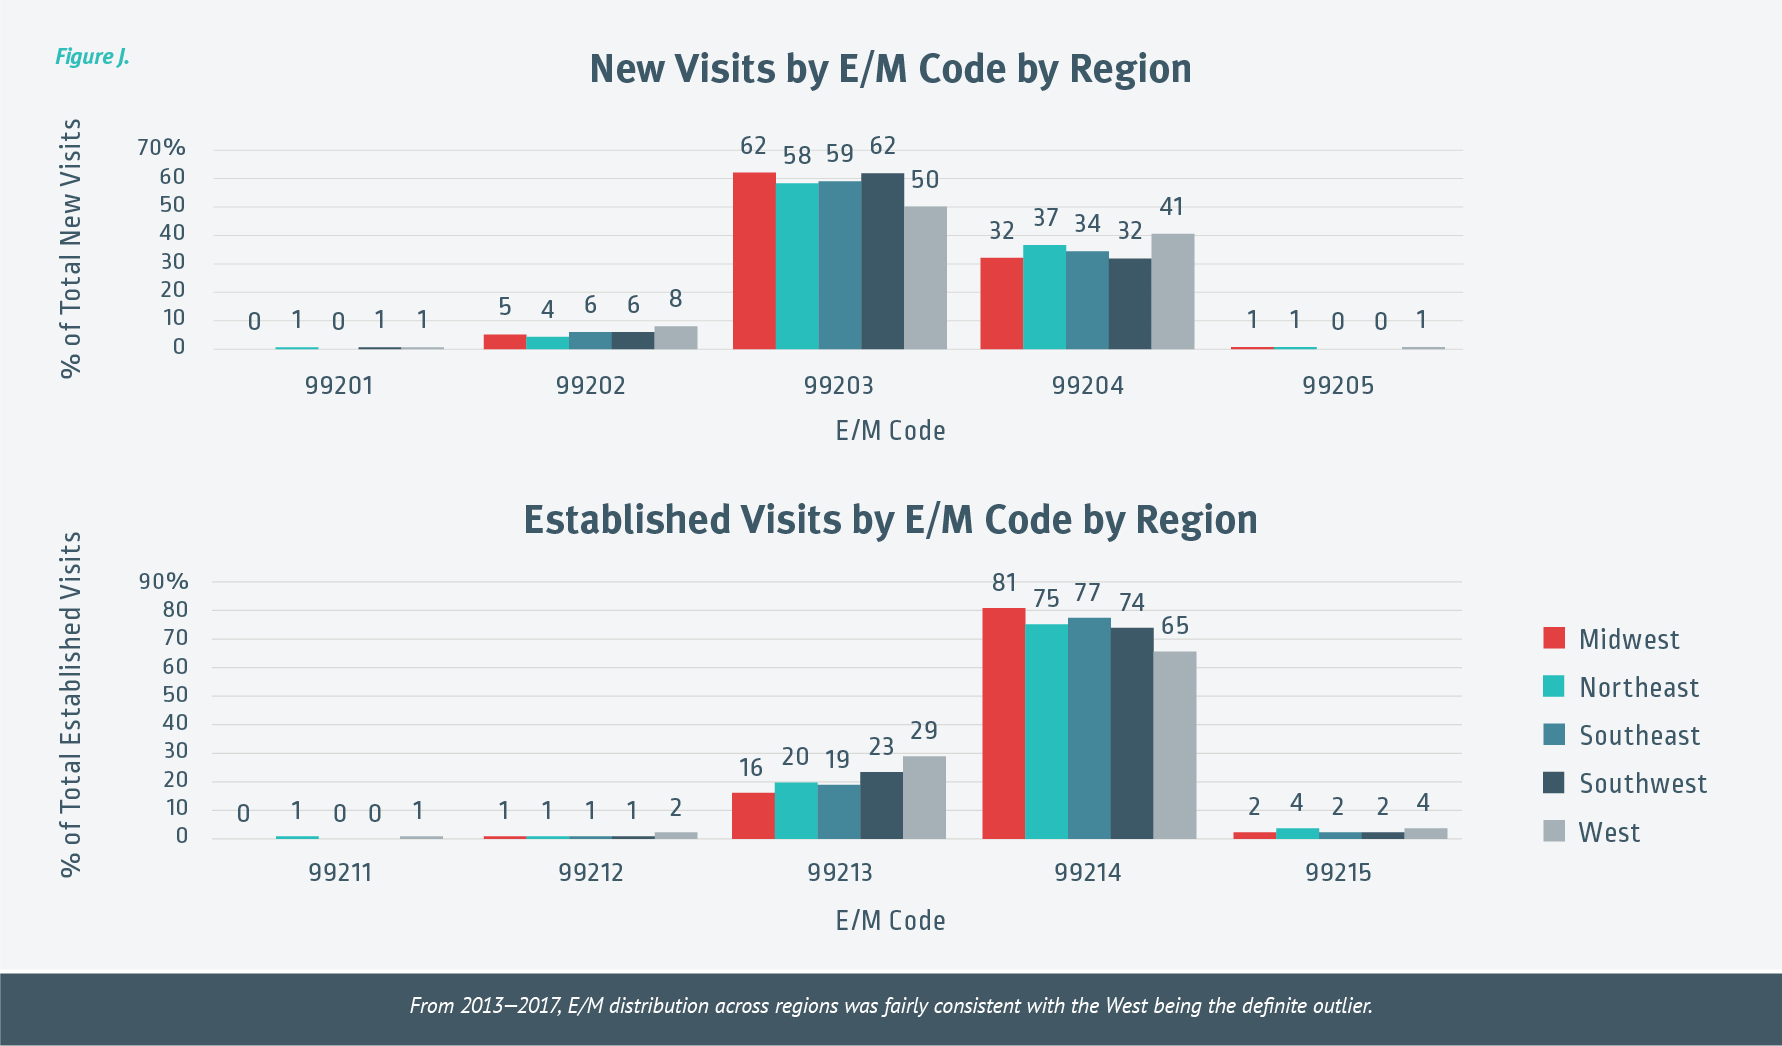
Over the last five years, E/M distribution across regions was fairly consistent, with the West being the definite outlier. For new visits, the West coded 12 percent fewer level threes than the Midwest and Southwest regions. With established visits, the West coded 16 percent fewer level fours than the Midwest region. [Figure J.]
FIGURE J.
THE TAKEAWAY
Coding affects every aspect of the urgent care experience. Accurate coding creates reliable medical records for patients that travel with them throughout their entire life and provides vital information to future caregivers.
Accurate coding also affects your clinics’ success. It’s essential that everyone involved in coding understands the connection between coding and reimbursement. Health technology companies offer, and continue to improve, software that takes some of the guesswork out of properly coding visits and claims. If done right, this increases accuracy, decreases claim rejections, and improves the overall urgent care revenue cycle.
At Experity, our goal has always been to provide a better urgent care experience. This is a big reason why we employ AAPC-certified coders. We stand behind our billing software and service, but more importantly, are committed to urgent care clinics as a trusted business partner. By sharing urgent care data, we further our goal and support the goals of urgent care clinics nationwide—providing a better urgent care experience for patients, providers, and everyone in between.