Sneak Peek: Urgent Care Quarterly Visit Volume Trends
September 14, 2021
2020 is now in the history books as a turbulent year for the industry. And as it turns out, 2021 has brought its own brand of ups and downs in visit volume. Now more than ever, it’s important to look at the urgent care data and use it as your guide for the near—and distant—future.
How will you adapt to the changes in the entire urgent care landscape, adjust to seeing more patients than ever before, and providing care in an uncertain flu season? Have you been looking for avenues for growth based on new needs within your community and ways to support your business all year long?
By looking at visit volume urgent care data over the last four years in the Urgent Care Quarterly, you can see where you’ve been and set goals for where you’re going.
In this issue, we explore the factors that have an impact on visit volume and revenue in the new era of urgent care. We look at how visit volume has changed over time and the trends that defined the last two years. We also explore how clinics are planning for future success.
More visits, when reimbursed accurately and efficiently, can help you reach your goals. A daily swing of even one visit per day can result in roughly a $43,000 difference in annual revenue for a single clinic. Use the data reported here and in the previous issue of the Urgent Care Quarterly to compare your business to industry benchmarks and make any necessary changes to fuel your success.
Here’s a sneak peek at the visit volume data you’ll find in the new issue.
The question on everyone’s mind is, what will visit volume look like this fall and winter? The past year has been unpredictable and will continue to be for urgent care. Current trends suggest that volume will keep climbing if we can unlock additional capacity in our clinics to see more people daily. At the same time, there’s the possibility that we will reach a potential plateau as clinics reach their daily capacity.
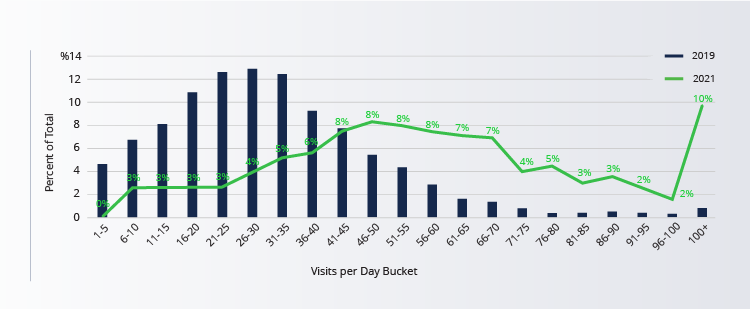
More urgent care clinics are seeing more patients daily according to our data. For the seven-day period ending August 24, 2021, 43 percent of clinics were seeing more than 60 patients per day, and 14 percent were seeing more than 90. In 2019, 42 percent of clinics were seeing 50 or fewer patients each day and only six percent of clinics were surpassing more than 60 patients per day. (See Figure A)

For the seven-day period ending August 24, 2021, 43% of clinics saw more than 60 patients per day, up from 6% in 2019.
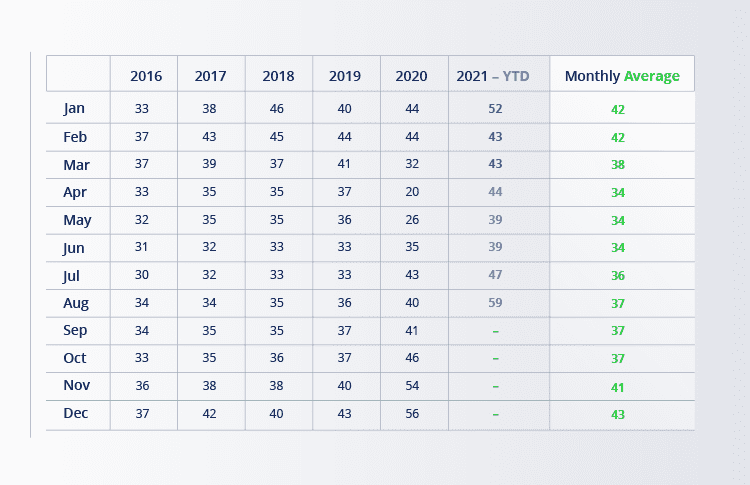
With the introduction of new variants, visits began to rise again. As of August 20, 2021, urgent cares are seeing, on average, 58 patients per day. Visits per day have more than doubled since the three-year historic average pre-COVID. (See Figure B)

Total urgent care visits have been higher than historical averages since January of 2020 with only short dips in volume. Total visits are now at the same levels we saw – nearly 60 visits per clinic per day on average – when COVID-19 peaked early in 2021.
Urgent Care clinics across the country were increasingly challenged to adjust their hours of operation during 2020 at the height of the COVID-19 pandemic. For many, it presented an opportunity to take a good look at peaks and valleys in visit volume and make changes.
When we look at the busiest times of day for urgent care, our data tells us that the busiest visit time is early in the day, peaking consistently year-over-year at 9 to 11 a.m. Visits are steady throughout the afternoon, and the slowest time of the day for urgent care clinics is between 6 and 8 p.m. (See Figure C)

Peak visit time is early in the day, peaking consistently year-over-year at 9 to 11 a.m. Visits are steady throughout the afternoon, and the slowest time of the day for urgent care clinics is between 5 and 8 p.m.
Prior to 2019, seeing 34 patients per day was the standard benchmark. But those times are gone, at least for now. Today, many clinics are seeing upwards of 50 patients per day, resulting in a need to speed up clinic workflows and engage patients in new ways. Looking at how your clinic measures up in comparison to these numbers is a reference point for performance.
If you want more data like this to help you make informed decisions about your business, the full version of the Urgent Care Quarterly – Urgent Care Visit Volume Trends is coming soon. Watch for it in October!
Join over 20,000 healthcare professionals who receive our monthly newsletter.