
Urgent Care Industry Visit & Diagnosis Trends: Q3 Comparisons
June 23, 2021
Since 2008, Urgent Care Association (UCA) has produced a benchmarking survey and report to provide insights that will help urgent care teams prepare for what is to come. Use this information to set your benchmarks and identify potential growth opportunities within your operations.
Here is a comparison of visit volume and diagnosis trends from quarter three in 2018, 2019, and 2020.
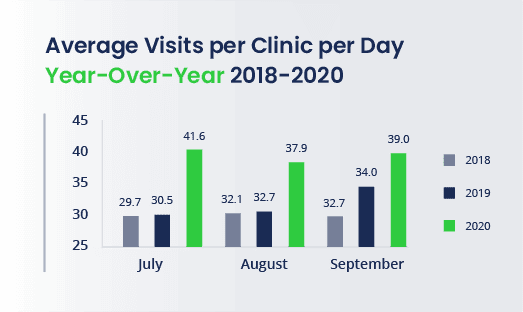
Visit volume is one of the most important performance metrics in urgent care. For this UCA report, we looked at averages from July, August, and September over the past three years to help you gauge your performance against industry benchmarks.
Average visit volume per clinic per day in 2018 and 2019 hovered right at the 32-visits-per-clinic-per-day mark. 2020 will always be an outlier due to the COVID-19 Public Health Emergency—and the data shows it. After the roughest quarter in history, quarter three of 2020 marked the beginning of urgent care’s resurgence. On Monday, July 6, 2020 (the Monday after Independence Day), Experity customers reported 105,639 visits nationwide, surpassing traffic for our customers’ busiest flu day earlier that year (February 3, 2020).
The 2020 visit volume rollercoaster marks the start of a new era in urgent care. The 2020 Q3 average of nearly 40 visits per clinic per day due to COVID-19 testing continued to rise higher and higher through the end of the year, challenging urgent care to improve efficiency to keep up with demand.
How is visit volume trending in 2021? Visit volume continues to ebb and flow at the 2018 and 2019 rate of 30-40 visits per clinic per day.
More data resources:
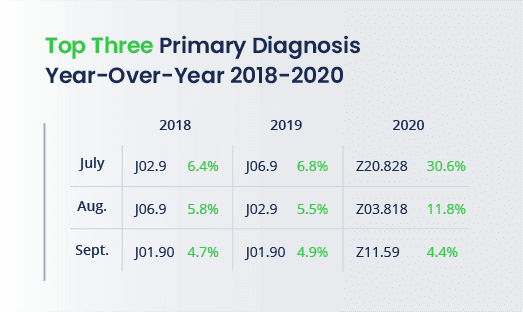
Urgent care was built on treating a handful of acute illnesses throughout the year. For this UCA report, we looked at the top three primary diagnoses from July, August, and September over the past three years to help you benchmark. In 2018 and 2019, the diagnosis codes were consistent and followed expected urgent care trends. In July, August, and September, upper respiratory infections, sore throats, and sinusitis topped the list. But in 2020, everything changed. The past year will always be an outlier due to the COVID-19 Public Health Emergency—and the data shows it. In quarter three of 2020, COVID visits were not surprisingly the most common of all urgent care visit types.
The story you’re starting to see is the coding dilemma that urgent care encountered when documenting and billing for COVID-19 through 2020.
You can read more about UCA benchmarking reports here. To learn about Experity’s products designed specifically for urgent care, explore the solutions on our homepage.

Join over 20,000 healthcare professionals who receive our monthly newsletter.

Join over 20,000 healthcare professionals who receive our monthly newsletter.