Tracking Urgent Care Visit Volume

Early 2026 Signals Sustained Demand

The latest 2026 data reinforces that urgent care demand remains seasonally driven with performance aligned with prior-year benchmarks. Regional variability persists, requiring localized operational strategies. Predictable lag effects continue to support forward-looking staffing and capacity planning.

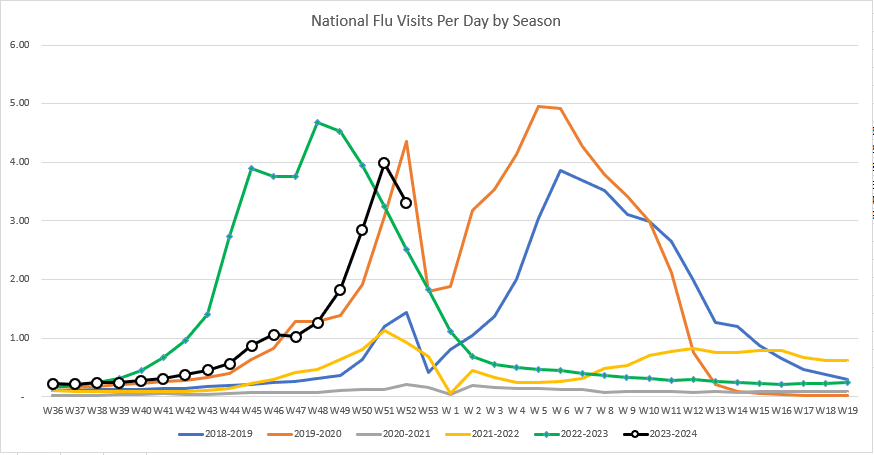
Seasonal flu activity continues to decrease according to the CDC, who classified the season’s severity as moderated. They estimate that there have been at least 32,000,000 illnesses, 380,000 hospitalizations, and 23,000 deaths from flu so far this season.

Last Updated May 6, 2026

Line graph showing 7-day average visits per clinic per day for PVP in 2014 (blue), 2015 projection (green), and actual 2015 data (red) from January to December 2015.

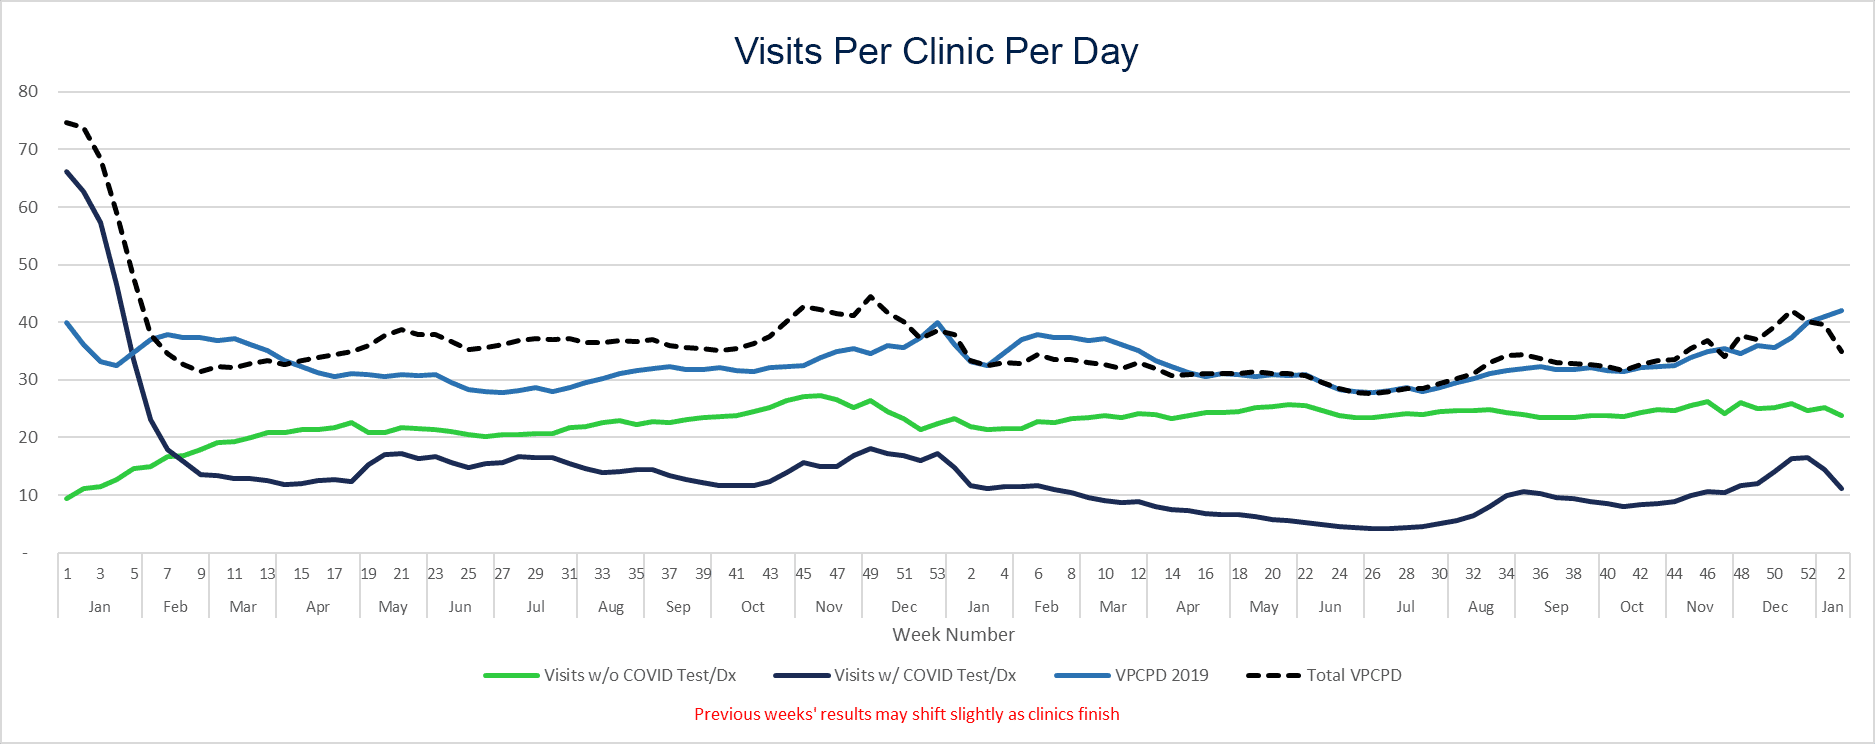
Visits Per Clinic Per Day

27 Average Daily Visits Per Clinic

At the start of 2026, visits per clinic per day (VCPD) surged into the mid-to-high 30s, aligning with a sharp increase in flu positivity across the U.S. Several states reported flu positivity rates exceeding 25–30%, particularly across the Midwest and Mountain West. Compared to early 2025, peak volumes in 2026 appear comparable but more sustained.

Source: Experity data

Line graph showing the 7-day average of clinic visits per day, flu tests per day, and flu test positivity rates from January 2023 to June 2024, highlighting seasonal flu peaks.

Visits per clinic per day VS. Flu Seasonality

Flu Positivity Down 15% Since March

In alignment with traditional flu trends, flu positivity continues to drop. The 7-day rolling average for flu positivity is down to 7%, dropping from 22% in March. As flu activity slows, visit volumes are holding steady.

Source: Experity Data

U.S. map showing state flu positivity rates; highest rates in Utah (22.5%), Arizona (20.9%), and Nevada (19.3%). Other states shaded by lower flu positivity percentages.

Flu Positivity

Mountain West Continues To See More Positive Flu Cases

Over the last month, our maps have generally turned to gray across the midwestern and eastern U.S. But in the west, flu season continues with positive cases in the 20% range. Flu positivity is highest in Nevada at 22.5% of labs returning with a positive result.

This uneven distribution continues to create localized demand surges, emphasizing the need for:

  • Flexible staffing models
  • Region-specific forecasting

Source: Experity Data

Map of the U.S. and parts of Mexico and Canada showing flu positivity data by state for the last 7 days, with orange circles indicating lab counts and positivity rates by location.

Flu Testing

Flu Hot Spots

According to our data, the highest concentration of flu testing is across the eastern and southeastern U.S.

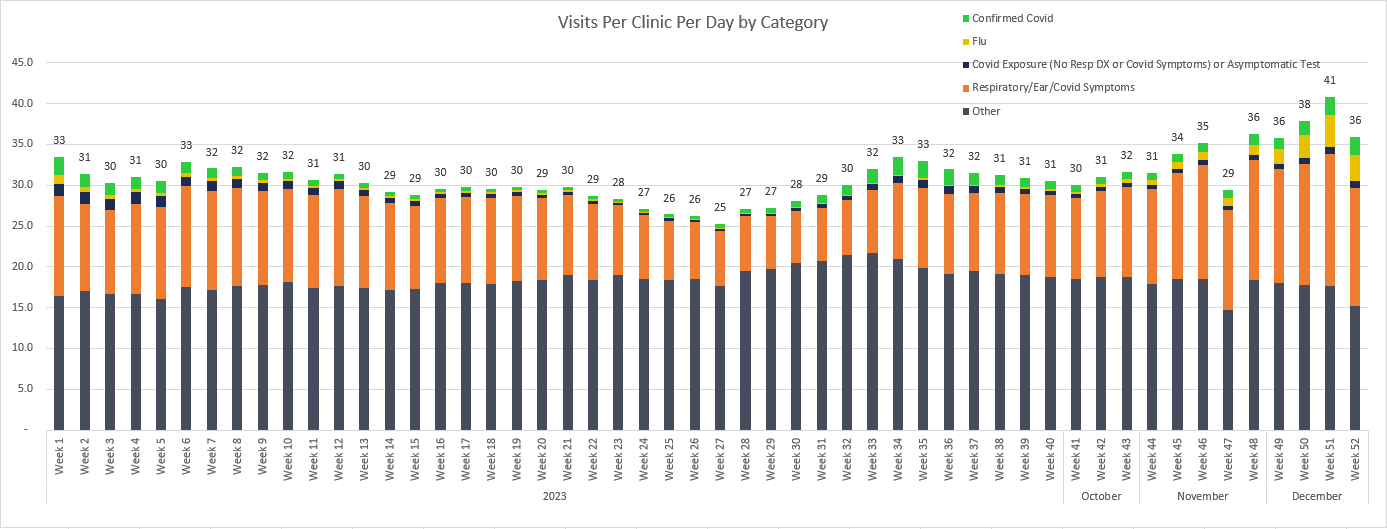
Bar chart showing average daily clinic visits by category (Flu, Covid, Respiratory, Other) from October to March, with totals ranging from 25.9 to 33.5 visits per day.

Visit Case Mix

Respiratory Drives Peaks, but Core Demand is Broad

While respiratory illness remains the primary catalyst for seasonal surges, it is important to note that the majority of visits are still driven by non-respiratory conditions. “Other” visit categories account for the largest share of volume year-round, reinforcing the role of urgent care as a broad access point for episodic healthcare needs, not just a destination for flu and COVID-related care.

The visit category breakdown continues to show “other” visits (~18–19 per day) as the dominant contributor; respiratory visits (~10–13 per day) expanding during peak periods; and flu and COVID representing a small but high-impact share. Even during peak flu activity, most visits are unrelated to flu, reinforcing that urgent care’s growth is not dependent on seasonal illness alone.

Resources to Revitalize your Urgent Care Business

Check out some of our top resources to help urgent cares manage and leverage fluctuating visit volume to secure continued business growth throughout the year.