
The Difference Between Reports and Business Intelligence
July 22, 2022
If you’re using an EMR/PM solution in urgent care, you likely have reporting capability. In fact, you probably have hundreds of reports you could run — most of which go unused. So why would you ever upgrade to a Business Intelligence (BI) tool?
While reports spit out numbers, BI makes them meaningful. To use an analogy, if reporting was a categorized list of every movie title available to you, BI is Netflix. It’s personalized, interactive, visual data that gives you the information you need to easily make a decision.
The clinical labs dashboard from Experity’s new BI module for our EMR/PM is one example of the key tools available in a BI toolbox. Now isn’t that better than a spreadsheet?
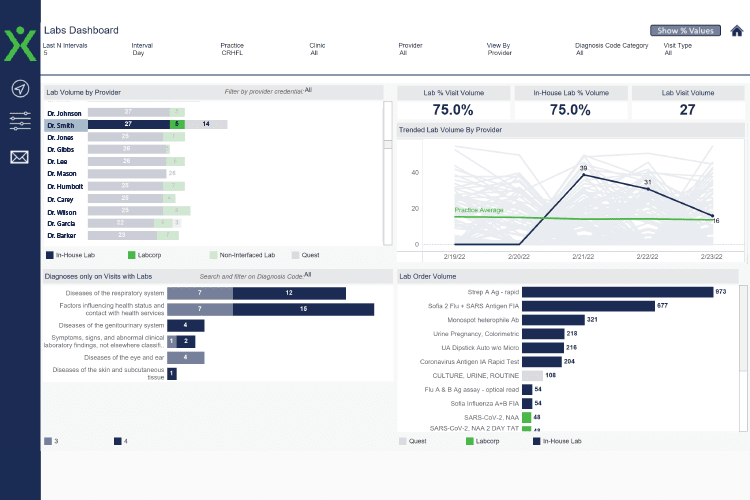
But what does visual data like this mean for the success of your urgent care? Let’s look more closely at what Business Intelligence actually does to empower you to transform your practice.
It’s a common misconception that BI is simply a form of reporting. In reality, reporting is pulling a flat set of numbers, which can be complicated and time-consuming to interpret — whereas BI provides easily-digestible visual layers of data that you can interact with to see the individual components that contribute to the high-level data.
Reports give you numbers, but BI gives you information by explaining the numbers quickly and easily so that you not only understand your business better, you get the insight to take meaningful action to improve.
Reports are useful for a high-level overview of what’s happened in a specific timeframe. For example, you can run reports to find your total door-to-door time for all visits in a given period at a specific clinic. You can run a separate report for that location to determine the total visits in that timeframe. Then you can divide the door-to-door time by the total visits to get your average door-to-door time. Repeat the process for every clinic to compare your locations.
This is a great metric to measure every month because your patient volume directly impacts your potential revenue. Door-to-door time also affects patient satisfaction. So you’ll want to know if it’s necessary to take action to improve it.
With reporting, however, you can’t see where patients are spending the most time.
Using BI dashboards that pair related metrics, you reduce the effort spent running numerous reports, and you can break down the data to identify where potential bottlenecks occur. You can get a complete set of throughput metrics that clearly show your exam versus waiting room time, visit duration versus volume, and door-to-door time by provider. (See image below.)
If you see some locations have longer waiting room times than others, it’s likely a volume-driven issue that can be addressed with preregistration and other tools that help reduce the amount of time needed to get a patient to an exam room. If data shows that certain providers are spending a lot of time with patients, that’s a good opportunity to meet with individuals and see if they’re struggling with the system, using their tools optimally, or need other behind-the-scenes help.
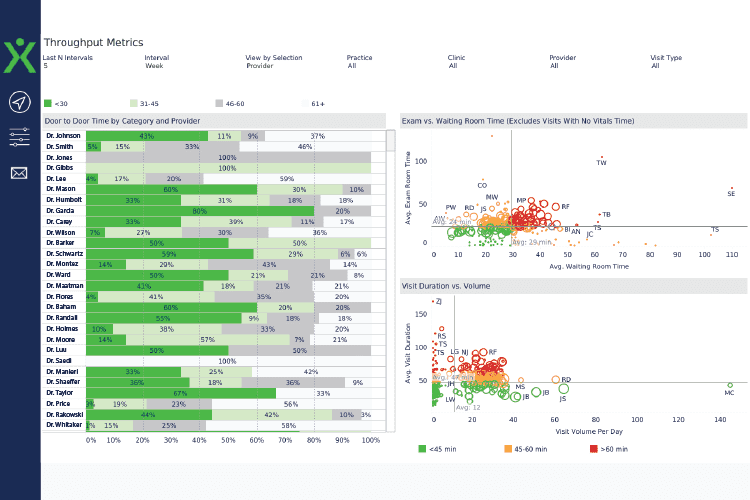
Looking at the top line of the screen in the image above, you see how you can change the data sets at the click of a button. You could, for example, filter this information down to a specific clinic and specific visit to see if you have an outlier clinic that is set up to handle something better or worse than your other locations.
With BI, you get the exact information you need to make decisions. No need for trial and error or pivot table magic to fix issues — you’ll see specific variables that contribute to each metric so you can drill down when you need to. BI provides a high-level, easy-to-interpret visual representation of data so you can quickly understand the state of your business at a glance.
Another example we can use is Claim Denial Rate. With BI, you can build a visualization layer of all the reason codes, history, invoice numbers, etc. This makes it easy to identify the root cause(s) of a high denial rate so you can build an action plan without using multiple reports or hiring an analyst to interpret spreadsheets.
The point here is that BI provides visuals that speak to you. By grouping related metrics and using visualization to paint a picture of your business, it decreases the complexity of your data. It shows you the real story of what’s happening at your clinic(s.) And a BI tool that’s specific to urgent care gives you relevant insights about your finances, operations, and clinical practices that allow you to take smarter action faster.
Gaining insights that help you make better business decisions is a compelling reason to use BI, but using a business intelligence tool does even more. Here are just a few more high-level benefits of using a business intelligence tool.
If you‘re considering BI for your urgent care, explore the solution that is designed specifically for you. Request a demo to see Experity’s EMR Platform in action. Or, if you want to learn more first, download our free eBook “Learn How Successful Urgent Cares Make Business Decisions.”

Join over 20,000 healthcare professionals who receive our monthly newsletter.

Join over 20,000 healthcare professionals who receive our monthly newsletter.