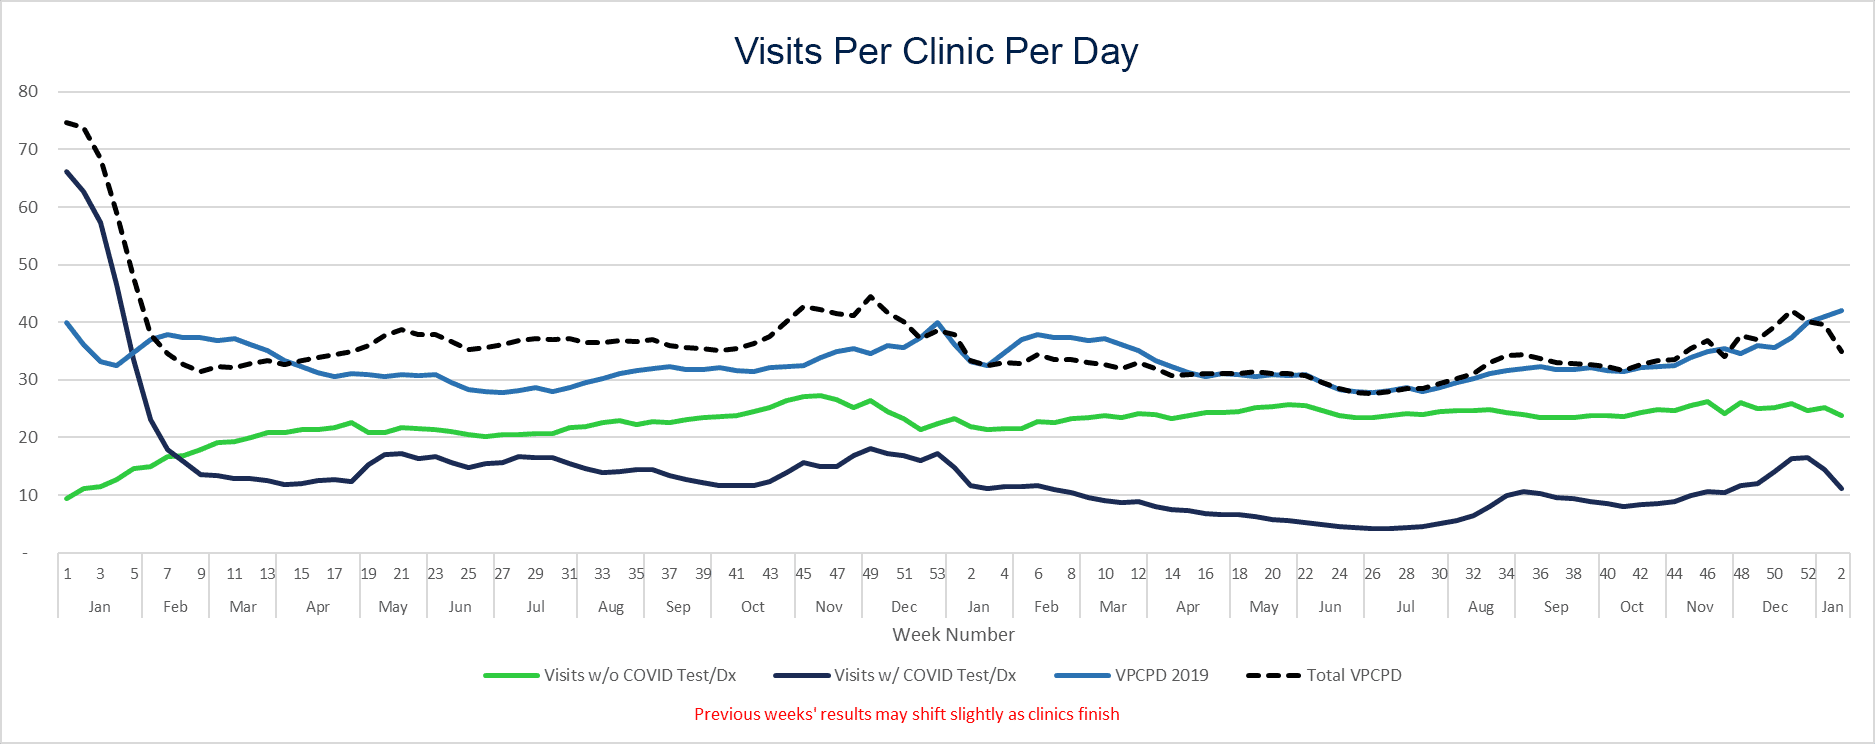
Visits Per Clinic Per Day
35 Average Daily Visits Per Clinic
The seven-day rolling average has been increasing month-over-month since October to an average of40+ visits per clinic per day at the end of December. We saw a slight drop over the holidays. When compared to pre-COVID data from 2019, the trend line for 2023 is consistent. Visits that included COVID testing also increased over the third quarter.